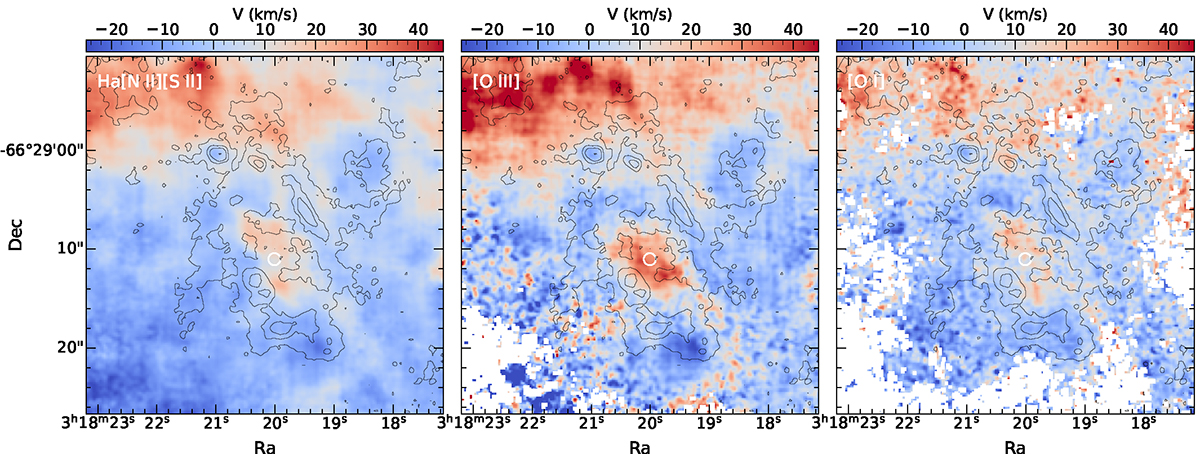
Fig. 7.
Download original image
Line-of-sight velocity maps over the system velocity of NGC 1313 (∼470 km s−1) for the combined [N II]-Hα and [S II] lines (left), [O III] (middle), and [O I]λ6300 (right). An offset of 25 km s−1 (the median value estimated from the whole map after excluding the central bubble) has been subtracted to reflect more closely the local velocities, which is in good agreement with the 30 km s−1 estimated at the position of NGC 1313 X–1 based on the values given by Ryder et al. (1995). The scale is the same in all panels, the contours as in Fig. 6.
Current usage metrics show cumulative count of Article Views (full-text article views including HTML views, PDF and ePub downloads, according to the available data) and Abstracts Views on Vision4Press platform.
Data correspond to usage on the plateform after 2015. The current usage metrics is available 48-96 hours after online publication and is updated daily on week days.
Initial download of the metrics may take a while.