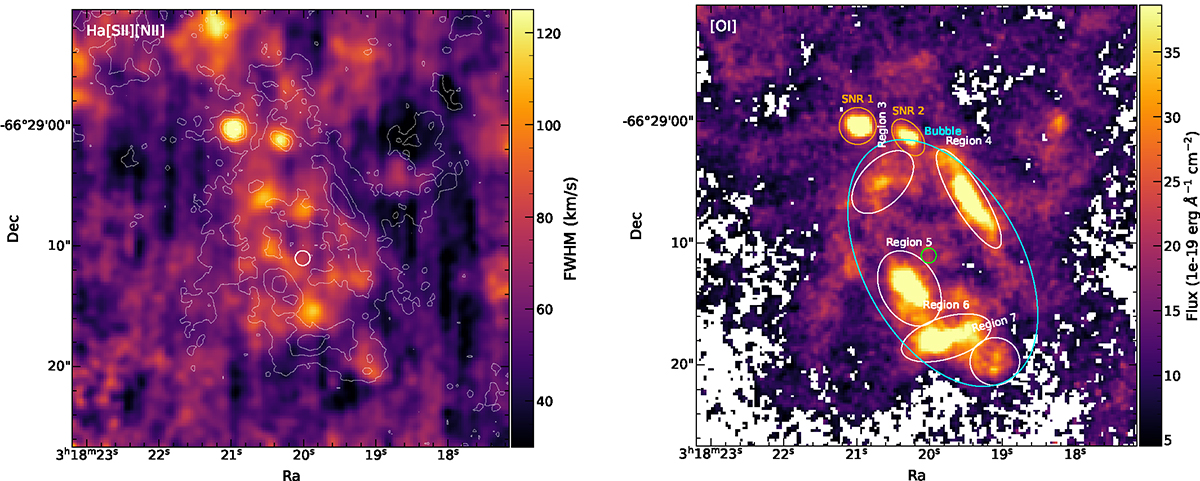
Fig. 6.
Download original image
Dispersion and flux maps of the region around NGC 1313 X–1. Left: The dispersion map of the average of the Hα, [N II]λ6853, and [S II]λ6716 lines, corrected for instrumental broadening (contours as in Fig. 2). The map has been smoothed with a Gaussian kernel with σ = 1.5 pixels. Right: [O I]λ6300 flux map showing some regions discussed throughout the paper, the ULX bubble (cyan), and the coincidentally close SNRs (orange). The position of the ULX is indicated with a green circle.
Current usage metrics show cumulative count of Article Views (full-text article views including HTML views, PDF and ePub downloads, according to the available data) and Abstracts Views on Vision4Press platform.
Data correspond to usage on the plateform after 2015. The current usage metrics is available 48-96 hours after online publication and is updated daily on week days.
Initial download of the metrics may take a while.