Fig. 4.
Download original image
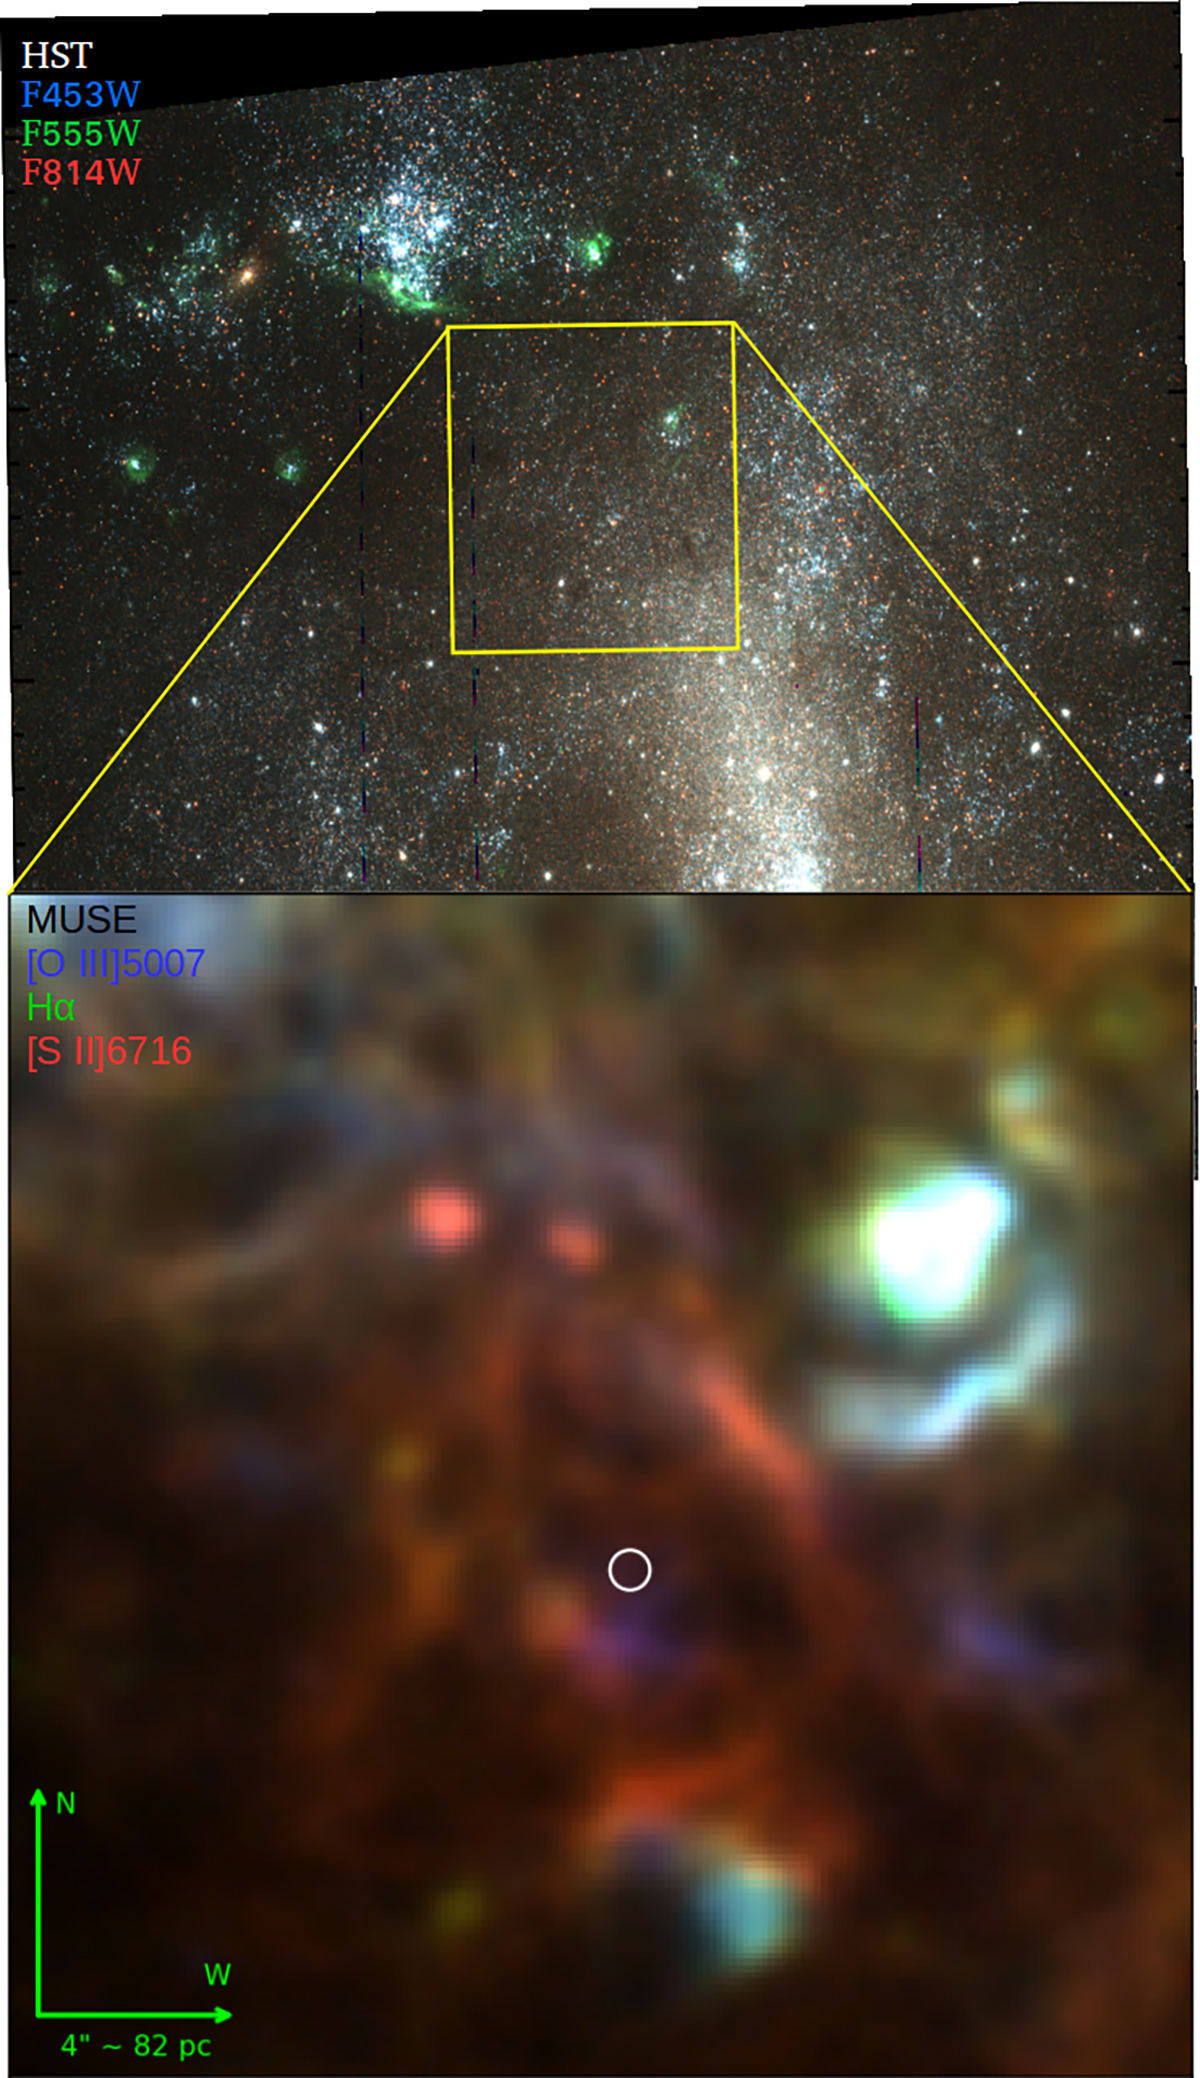
Top: composite HST image showing F435W (Blue), F555W (Green) and F814W (red) ACS/WFC images downloaded from the HLA archive (ObsID hst_9796_01_acs_wfc_f814w_f555w_f435w). The yellow square shows the region shown in the MUSE image in the bottom panel. Bottom: MUSE RGB image of the nebula around NGC 1313 X–1 corresponding to the yellow square in the HST image, showing fluxes in Hα (green channel), [O III]λ5007 (blue channel) and [S II]λ6717 (red channel) lines.
Current usage metrics show cumulative count of Article Views (full-text article views including HTML views, PDF and ePub downloads, according to the available data) and Abstracts Views on Vision4Press platform.
Data correspond to usage on the plateform after 2015. The current usage metrics is available 48-96 hours after online publication and is updated daily on week days.
Initial download of the metrics may take a while.