Fig. 19.
Download original image
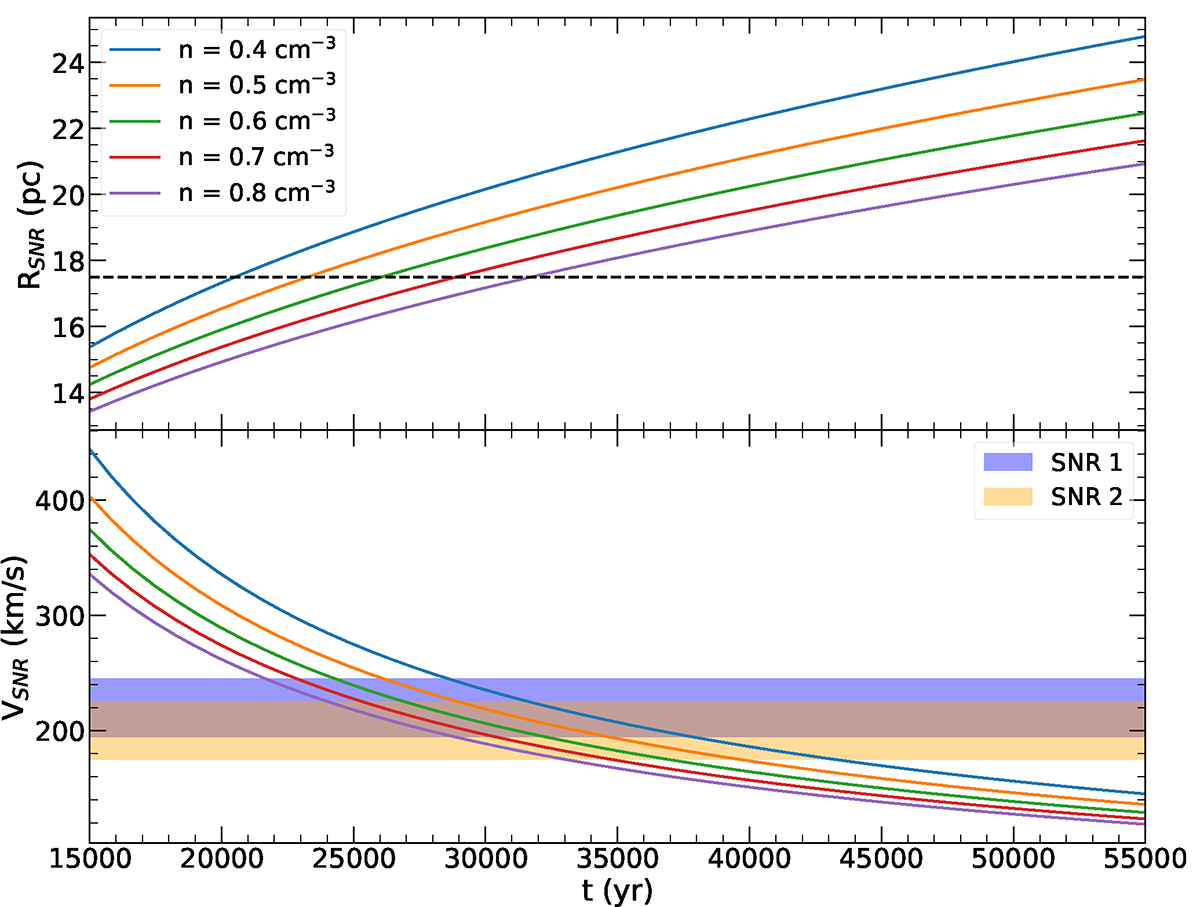
Evolution of the radius and expansion velocity of a SNR (green shaded areas) as a function of time for the pressure-drive snowplough phase using the analytical expressions from Cioffi et al. (1988) for an initial explosion energy of 0.5 × 1051. The evolution is calculated for the typical range of values found for nISM in Sect. 3.5 (Table 5). The dashed line indicates the radii of the SNRs measured from the HST images (Fig. 9) and the blue and yellow shaded areas represent the range of shock velocities determined in Sect. 3.4 (Table 5) for SNR 1 and 2, respectively.
Current usage metrics show cumulative count of Article Views (full-text article views including HTML views, PDF and ePub downloads, according to the available data) and Abstracts Views on Vision4Press platform.
Data correspond to usage on the plateform after 2015. The current usage metrics is available 48-96 hours after online publication and is updated daily on week days.
Initial download of the metrics may take a while.