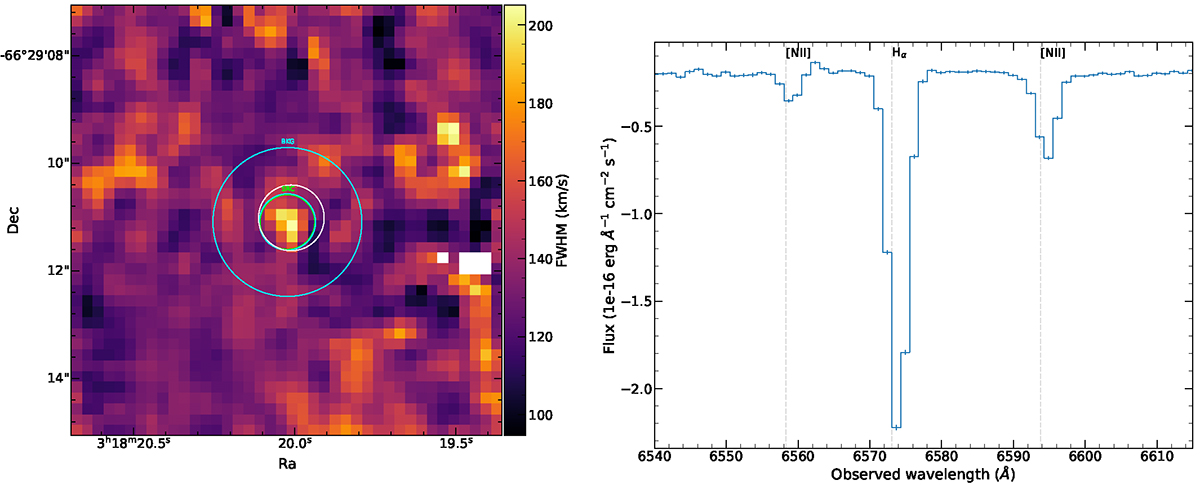
Fig. 17.
Download original image
Extraction regions and optical spectrum of the counterpart. Left: Dispersion map for the [O I]λ6300 line showing the enhancement around the ULX position and the extraction regions used. The extraction regions for the source and background are shown in green and cyan, respectively, whereas the white circle shows the ULX positions as determined in Sect. 2. Right: MUSE background-subtracted spectrum of the optical counterpart around the Hα-[N II] complex. The main nebular lines are labelled and their expected positions based on the redshift of the galaxy are indicated with grey dashed lines.
Current usage metrics show cumulative count of Article Views (full-text article views including HTML views, PDF and ePub downloads, according to the available data) and Abstracts Views on Vision4Press platform.
Data correspond to usage on the plateform after 2015. The current usage metrics is available 48-96 hours after online publication and is updated daily on week days.
Initial download of the metrics may take a while.