Fig. 11.
Download original image
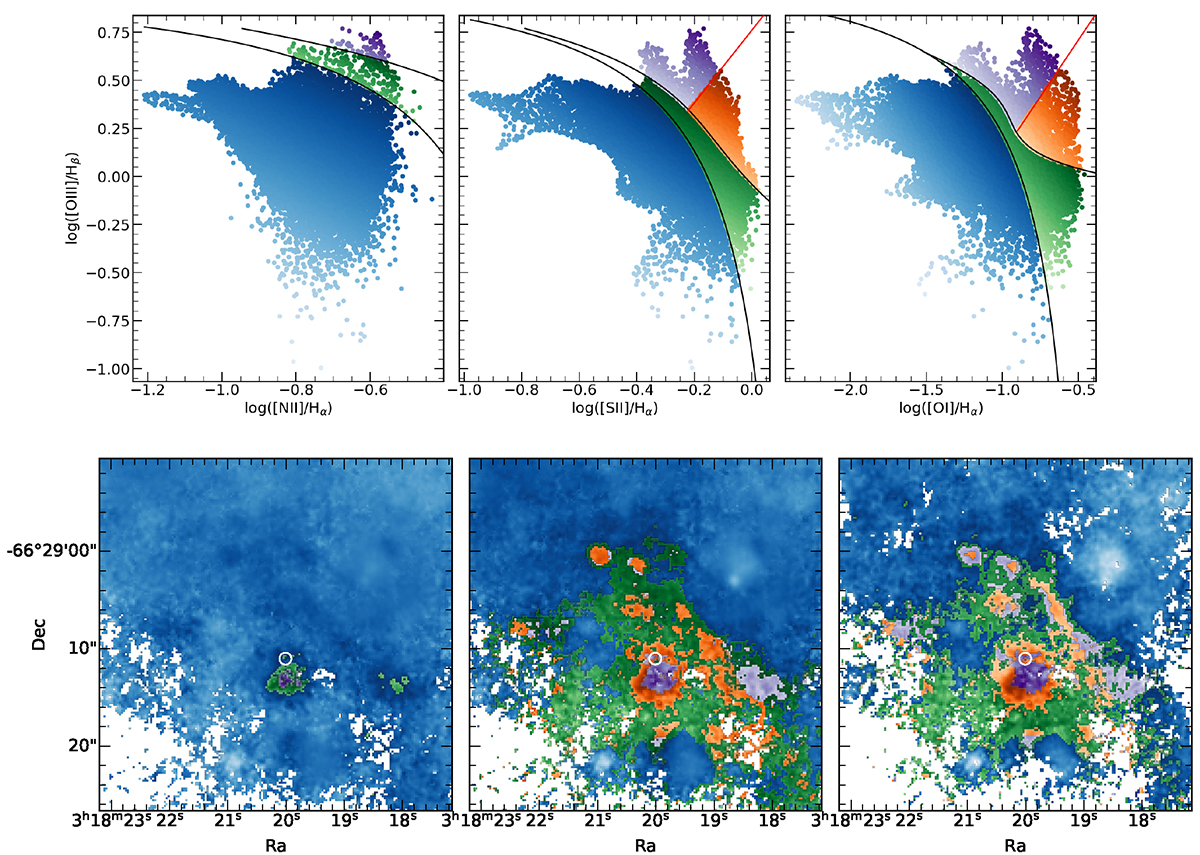
Results of the spatially-resolved BPT diagrams using the classification proposed by Law et al. (2021). Regions classified as HII, intermediate, AGN, and LINER are shown in blue, green, purple, and orange, respectively. Top panels: classification of each pixel based on the line ratios, whereas the bottom panels show their corresponding location. Each pixel has been colour-coded proportionally to the sum of the x and y values in all panels to aid the visualisation and localisation of each pixel in the bottom panels.
Current usage metrics show cumulative count of Article Views (full-text article views including HTML views, PDF and ePub downloads, according to the available data) and Abstracts Views on Vision4Press platform.
Data correspond to usage on the plateform after 2015. The current usage metrics is available 48-96 hours after online publication and is updated daily on week days.
Initial download of the metrics may take a while.