Fig. 3.
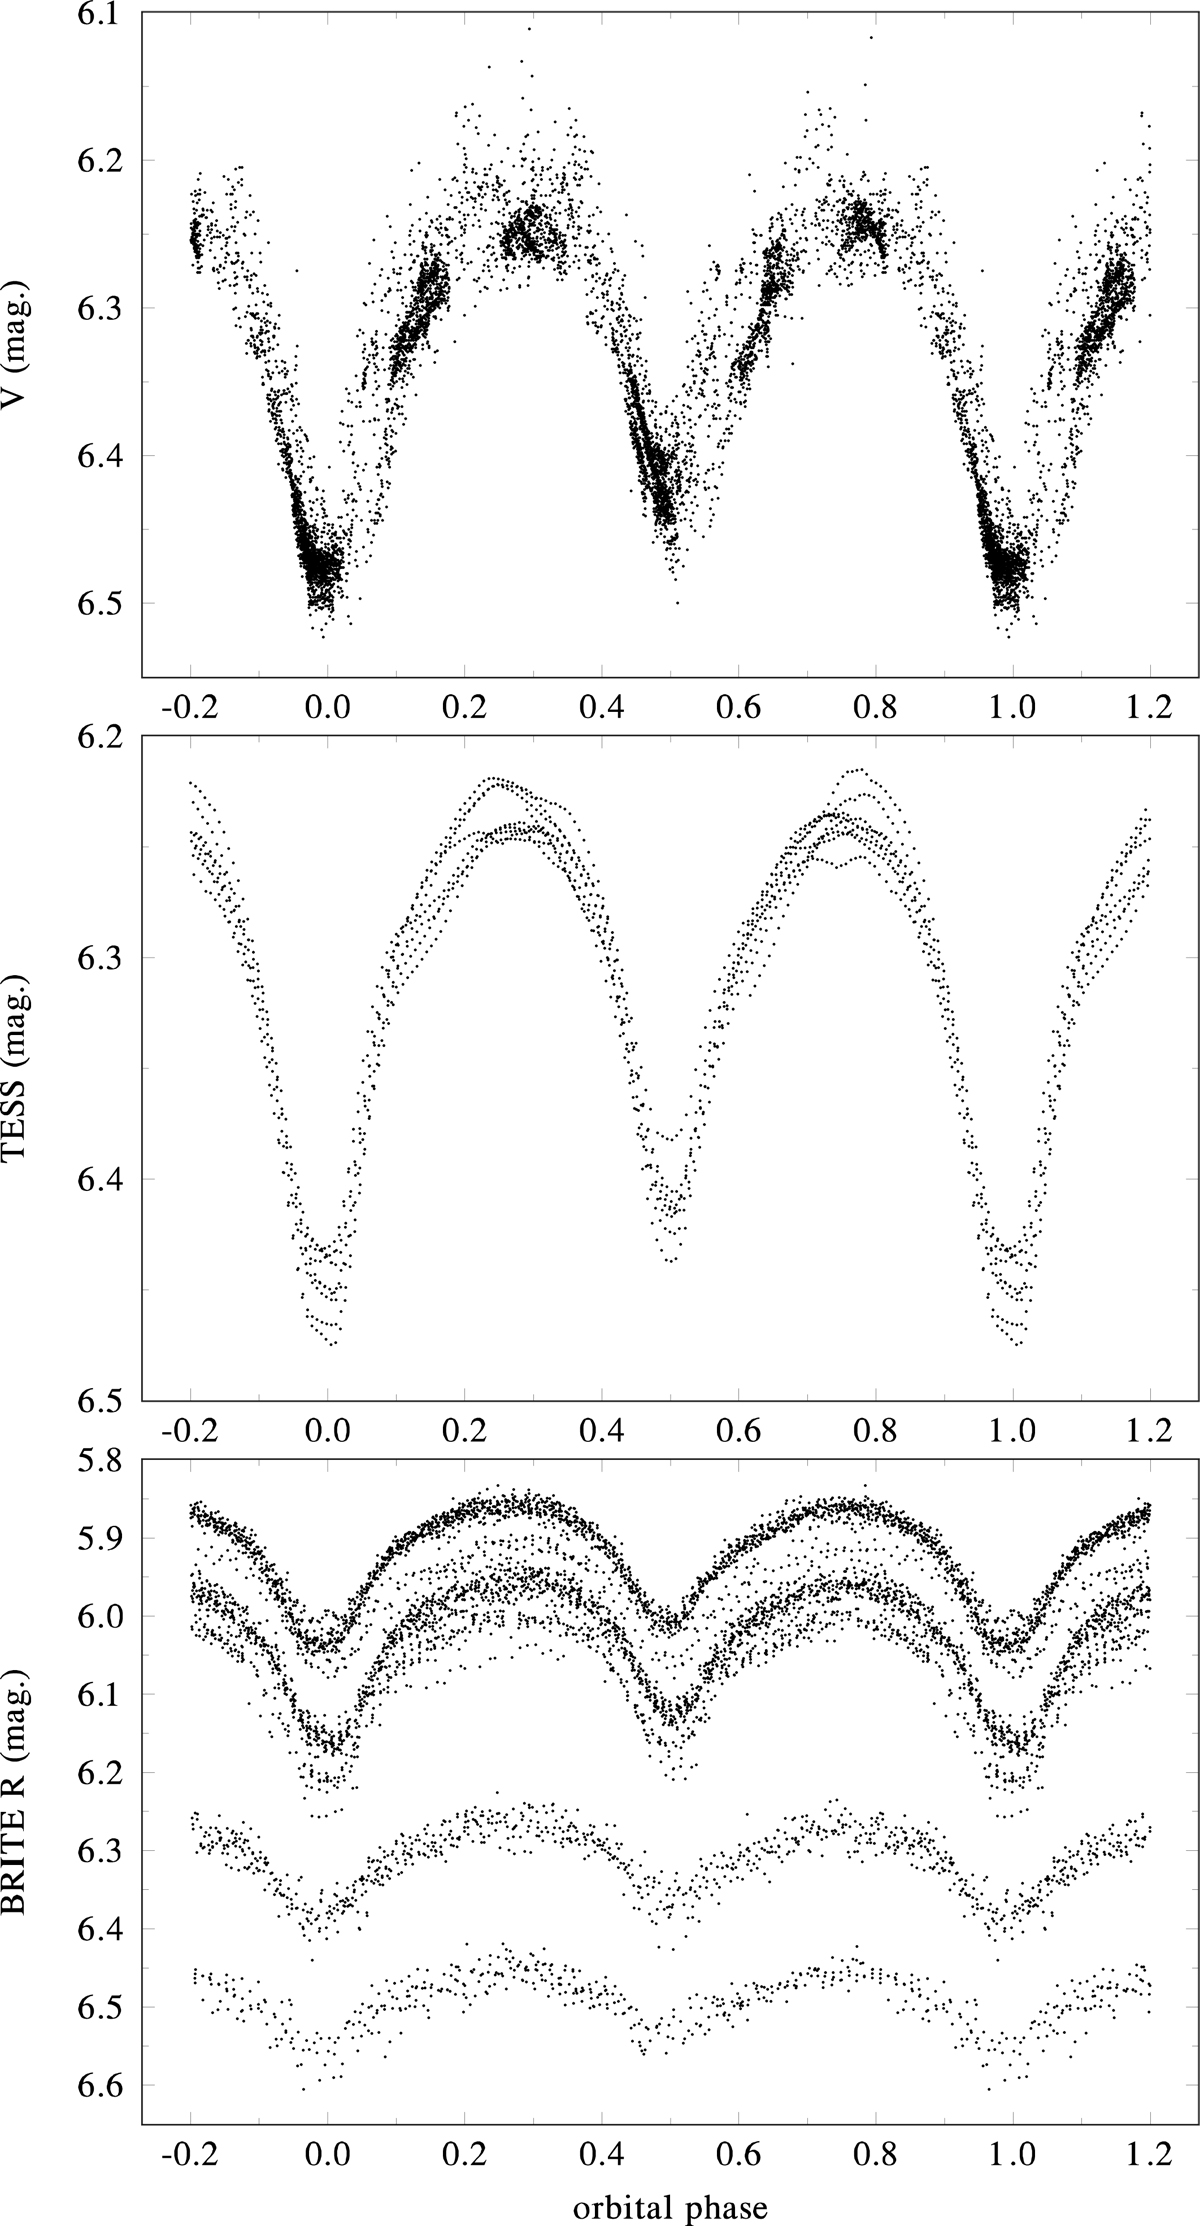
Download original image
Light curve of the eclipsing system Ac based on all homogenised V band observations at our disposal, and on all BRITE R band and TESS broad band space photometries plotted for the ephemeris (2). We deliberately show the BRITE data for their original ‘setups’, which have different zero levels (see Appendix C for details). We note that the bottom two BRITE light curves have lower amplitudes than the rest. This is caused by the fact that part of the stellar light was captured by pixels in the defective part of the detector. These light curves are not usable for the final light-curve solution but can still be used to make local determinations of the times of minima discussed here.
Current usage metrics show cumulative count of Article Views (full-text article views including HTML views, PDF and ePub downloads, according to the available data) and Abstracts Views on Vision4Press platform.
Data correspond to usage on the plateform after 2015. The current usage metrics is available 48-96 hours after online publication and is updated daily on week days.
Initial download of the metrics may take a while.