Fig. 11.
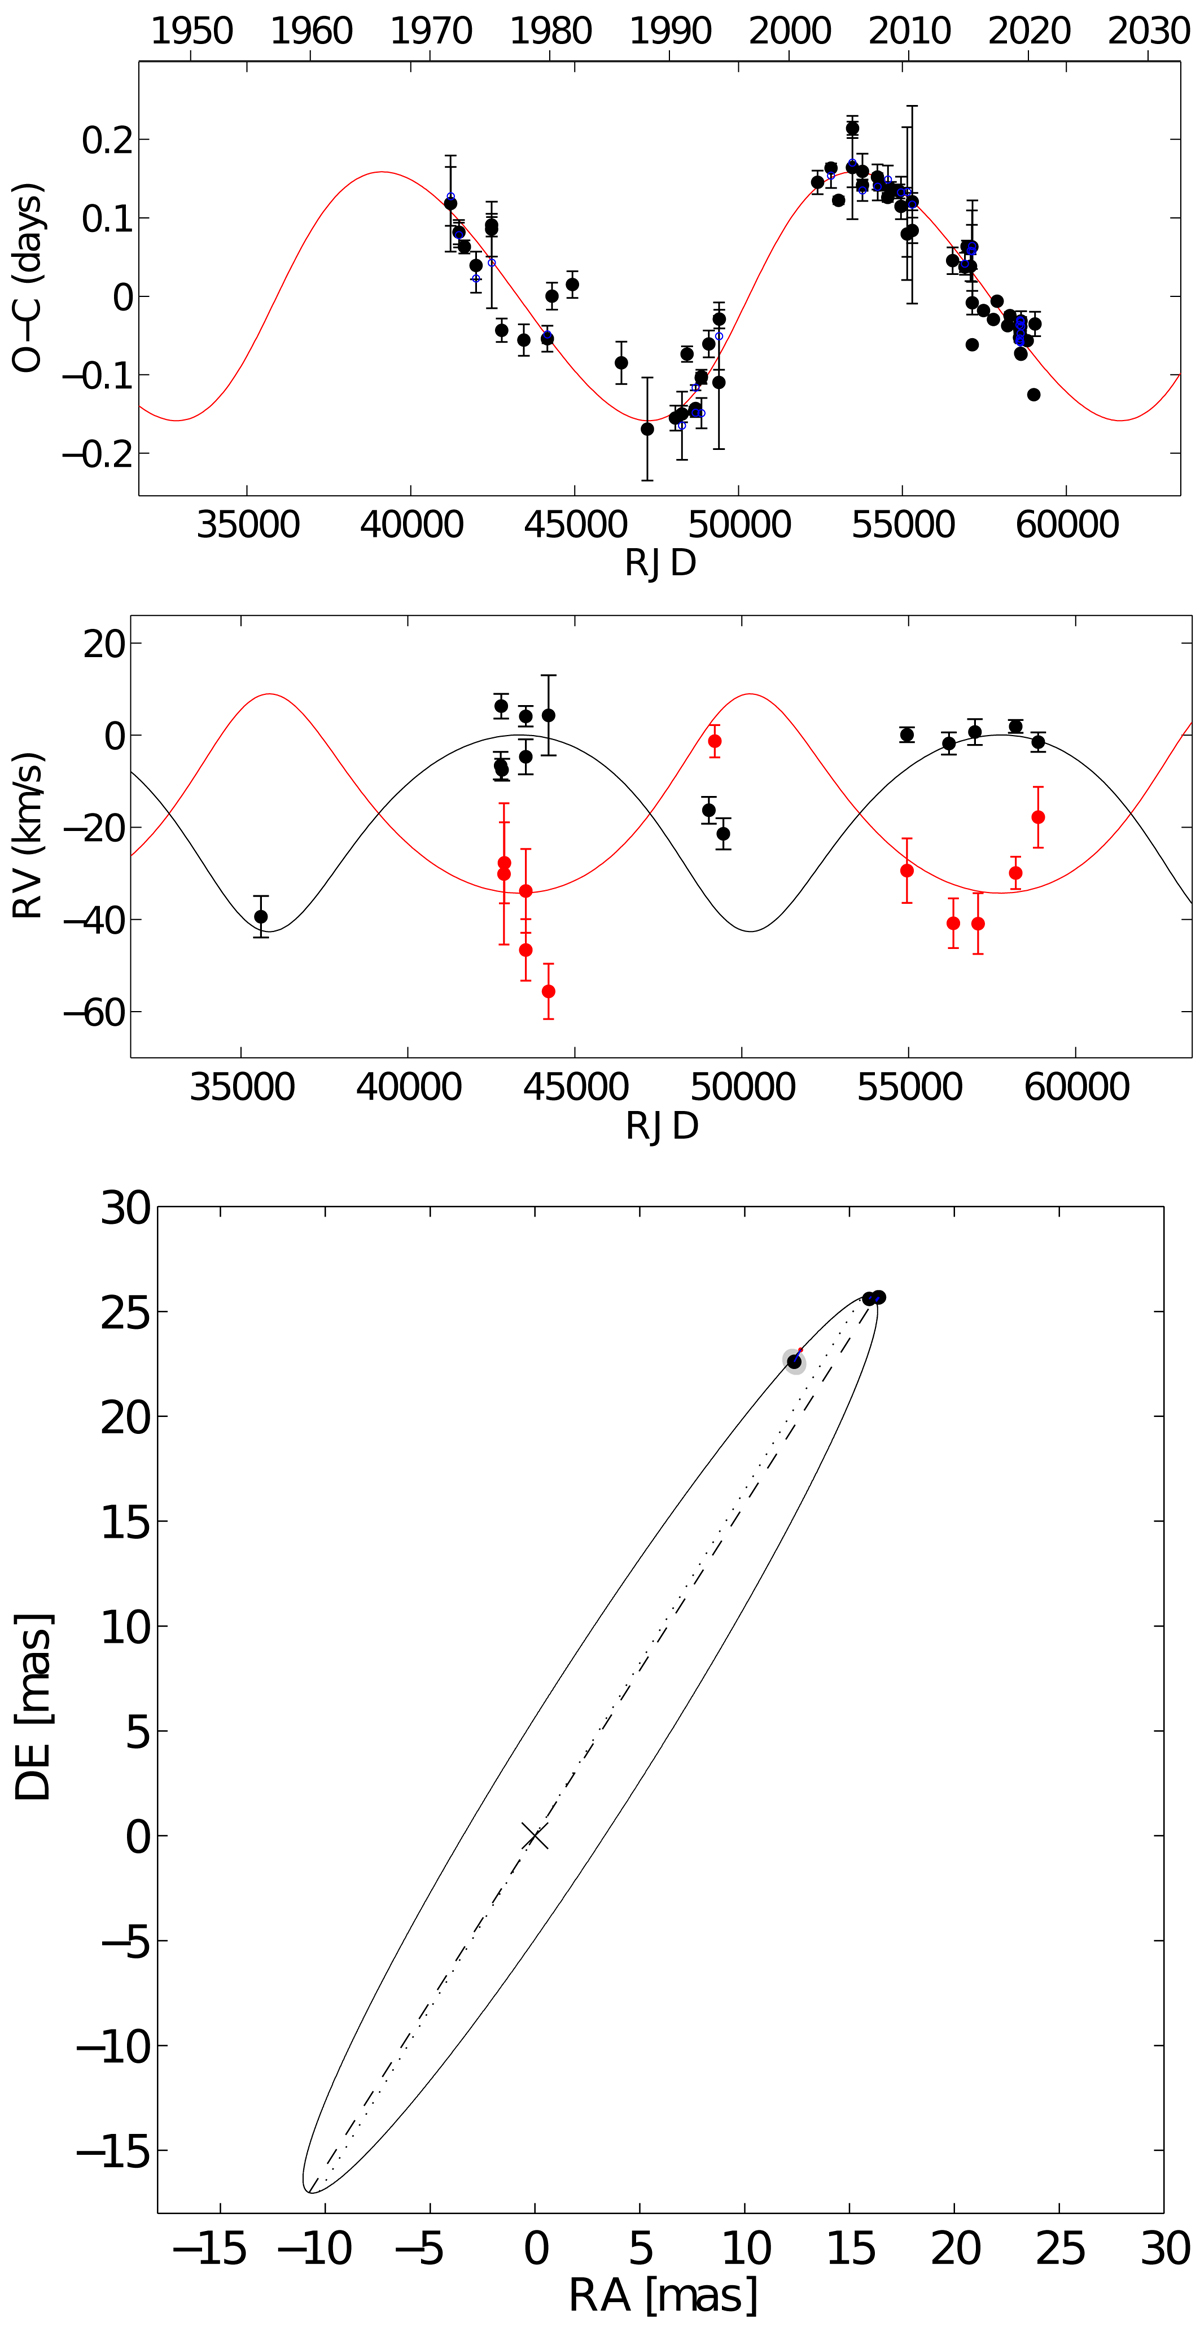
Download original image
A combined fit of data for the long period of 14 403 d. Top panel: The O − C deviations from the times of primary minima. Middle panel: systemic velocities of components Aa1 (black) and Ac1 (red). Bottom panel: corresponding spatial long orbit, which fits the four precise interferometric observations, with the pairs Aa and Ac resolved.
Current usage metrics show cumulative count of Article Views (full-text article views including HTML views, PDF and ePub downloads, according to the available data) and Abstracts Views on Vision4Press platform.
Data correspond to usage on the plateform after 2015. The current usage metrics is available 48-96 hours after online publication and is updated daily on week days.
Initial download of the metrics may take a while.