Fig. 6.
Download original image
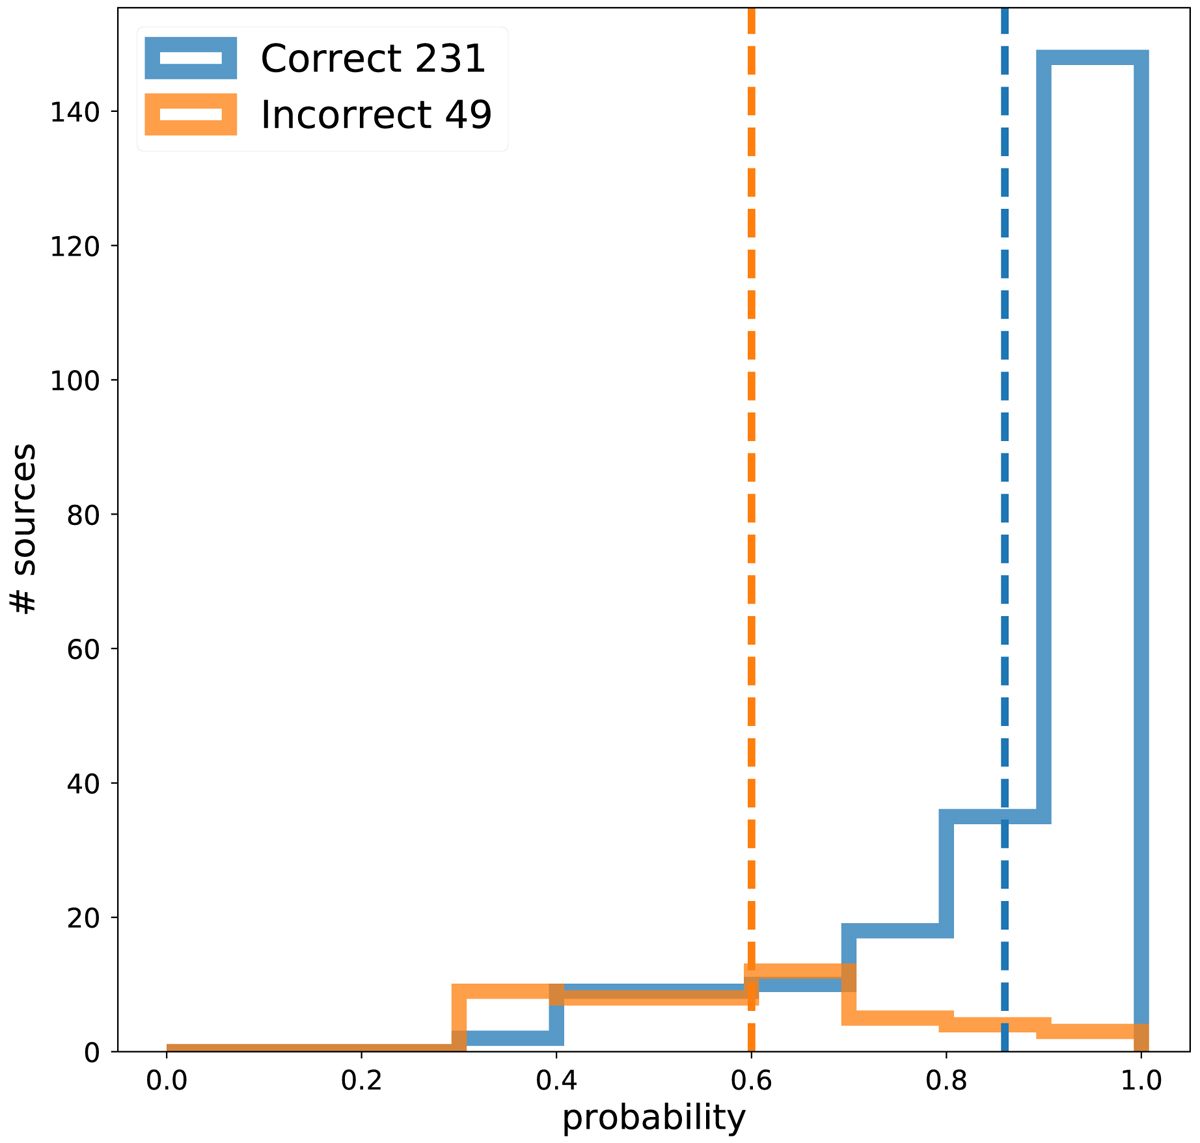
Probability distributions for sources classified correctly (blue) and incorrectly (orange), for the validation sample. We successfully recover the majority of the objects in the validation sample (∼83%). The dashed blue and orange lines correspond to the mean probability values for the correct (at 0.86) and incorrect (at 0.60) classifications, based on repeated five-fold CV tests (five iterations).
Current usage metrics show cumulative count of Article Views (full-text article views including HTML views, PDF and ePub downloads, according to the available data) and Abstracts Views on Vision4Press platform.
Data correspond to usage on the plateform after 2015. The current usage metrics is available 48-96 hours after online publication and is updated daily on week days.
Initial download of the metrics may take a while.