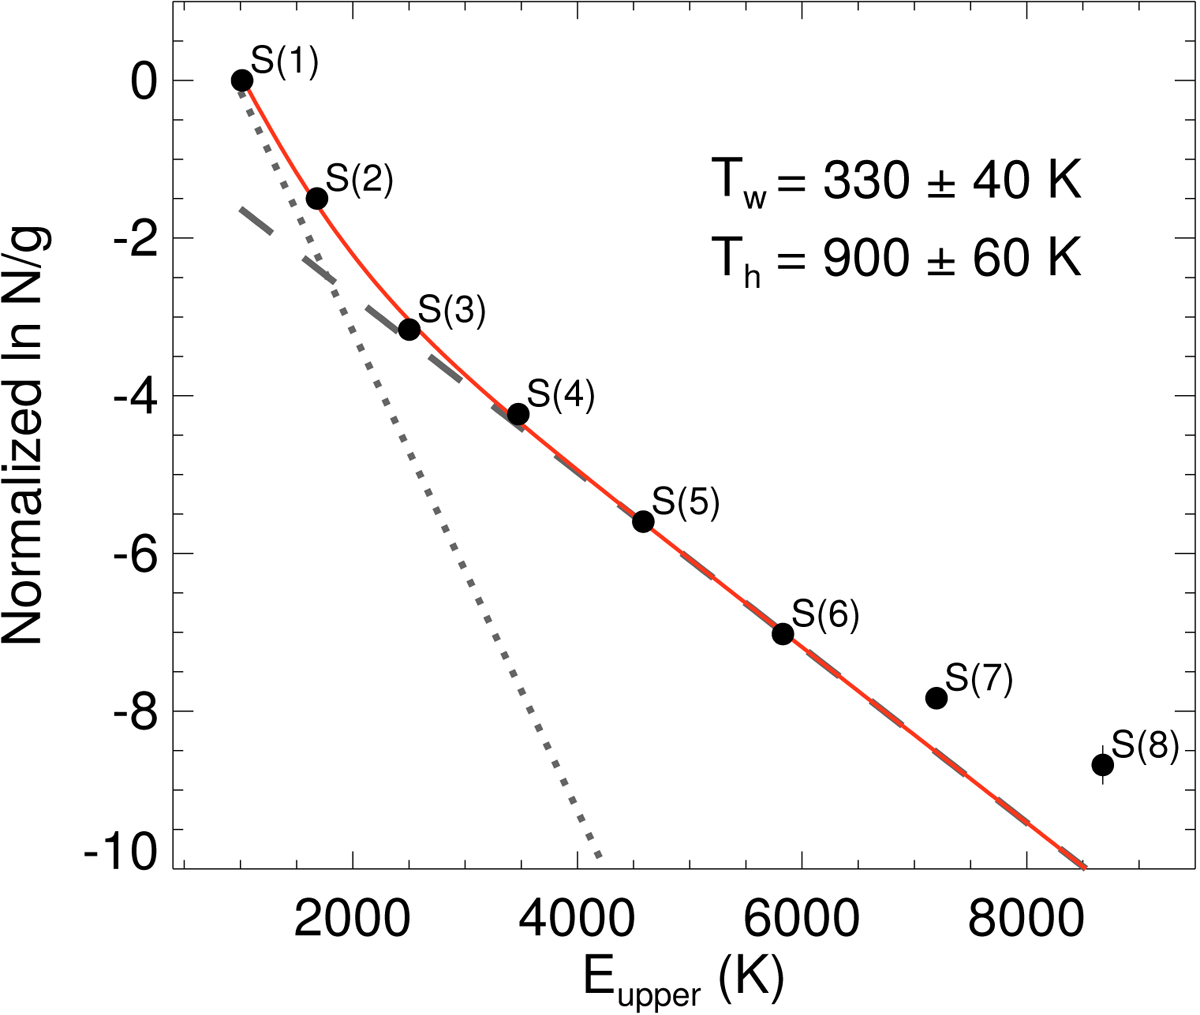
Fig. 5.
Download original image
Rotational diagram showing the H2 0–0 S(1) to S(8) transitions measured at the northern radio hotspot, N2, assuming the ortho-to-para ratio of 3 expected for Trot> 200 K (Burton et al. 1992). The red line is the best LTE fit with two temperatures to the S(1)–S(6) lines. The dotted (dashed) line represents the warm (hot) component. The solid red line is the sum of the two components.
Current usage metrics show cumulative count of Article Views (full-text article views including HTML views, PDF and ePub downloads, according to the available data) and Abstracts Views on Vision4Press platform.
Data correspond to usage on the plateform after 2015. The current usage metrics is available 48-96 hours after online publication and is updated daily on week days.
Initial download of the metrics may take a while.