Fig. 4
Download original image
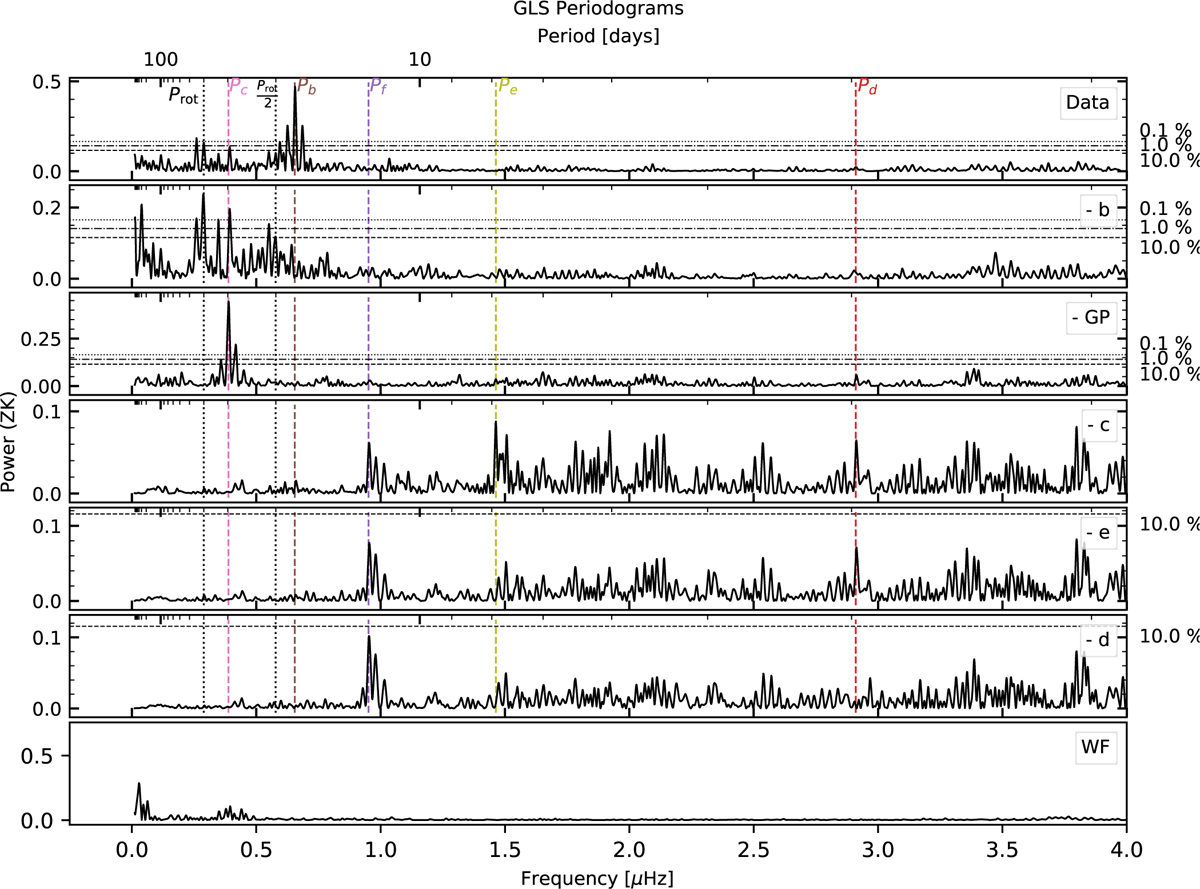
Iterative GLS for the five planet model. The top panel shows the GLS of the RVs (ESPRESSO and PFS after correcting for the instrument offset). The subsequent panels show the previous row minus the model of planet b, model of the GP, model of planet c, model of planet e, and model of planet d, respectively. The last panel shows the window function. The horizontal lines indicate the 10% (dashed line), 1% (dot-dashed line), and 0.1% (dotted line) FAP levels calculated following Zechmeister & Kürster (2009).
Current usage metrics show cumulative count of Article Views (full-text article views including HTML views, PDF and ePub downloads, according to the available data) and Abstracts Views on Vision4Press platform.
Data correspond to usage on the plateform after 2015. The current usage metrics is available 48-96 hours after online publication and is updated daily on week days.
Initial download of the metrics may take a while.