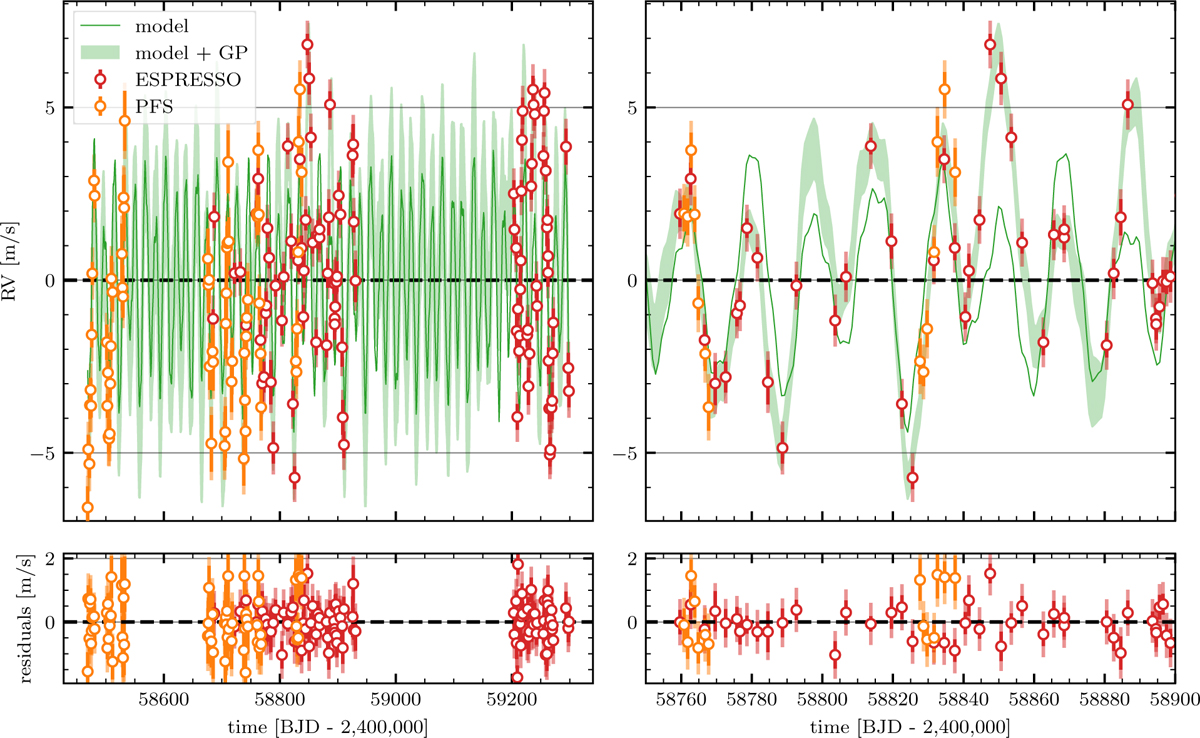
Fig. A.1
Download original image
Time series of the RVs of ESPRESSO (in red) and PFS (in orange) together with the best fit model (in green) with five planets and GP to account for stellar activity (left panel). We show the 1 σ uncertainties from the GP model in shaded green. The systemic velocity and the offset between the two instruments was corrected. The residuals of the best model are shown in the bottom panel. Zoom of the left panel is shown on the right, displaying the middle season of observations when the ESPRESSO and the PFS observations overlap.
Current usage metrics show cumulative count of Article Views (full-text article views including HTML views, PDF and ePub downloads, according to the available data) and Abstracts Views on Vision4Press platform.
Data correspond to usage on the plateform after 2015. The current usage metrics is available 48-96 hours after online publication and is updated daily on week days.
Initial download of the metrics may take a while.