Fig. 1
Download original image
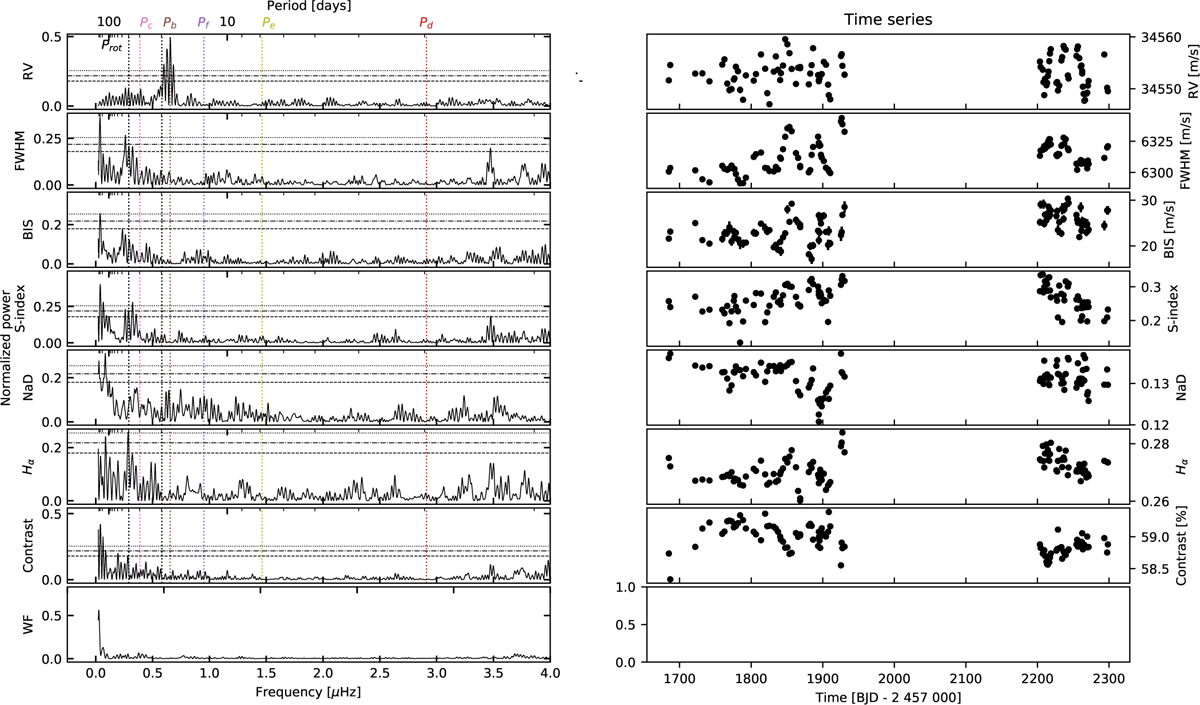
Left panel: GLS of the RVs and indicators of the new ESPRESSO observations. The last row shows the window function. The coloured dotted vertical lines show the position of the known transiting planets, while the black dotted vertical lines show the position of the estimated rotation period of the star and its first harmonic. The horizontal lines indicate the 10% (dashed line), 1% (dot-dashed line), and 0.1% (dotted line) FAP levels calculated following Zechmeister & Kürster (2009). Right panel: time series of the RV observations and the activity indicators.
Current usage metrics show cumulative count of Article Views (full-text article views including HTML views, PDF and ePub downloads, according to the available data) and Abstracts Views on Vision4Press platform.
Data correspond to usage on the plateform after 2015. The current usage metrics is available 48-96 hours after online publication and is updated daily on week days.
Initial download of the metrics may take a while.