Fig. 5
Download original image
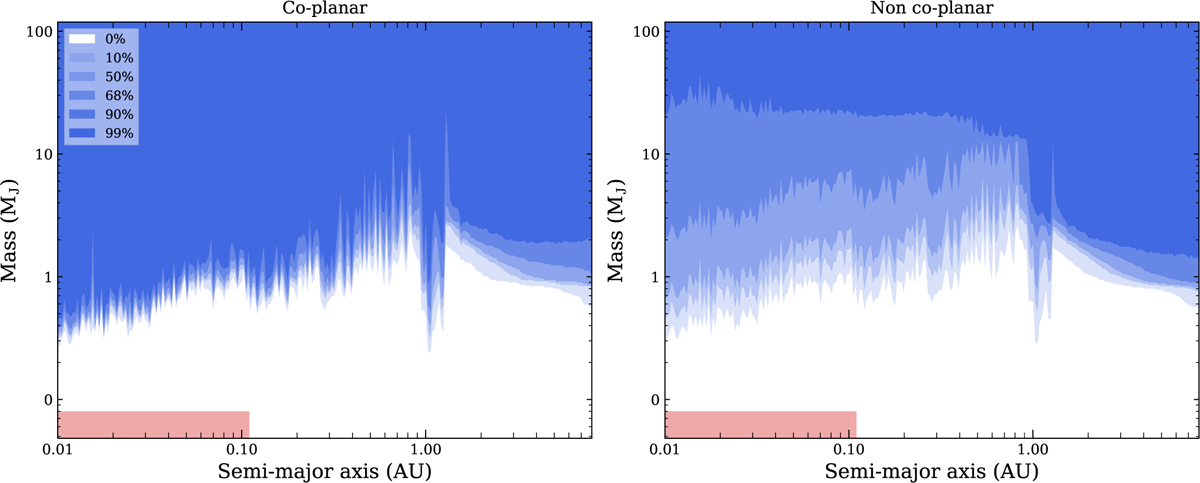
Detection probability maps of AU Mic assuming coplanarity with the disc (left panel) or with no hypothesis on the inclination (right panel), combining RV, interferometric, and direct-imaging observations. Blue colour-coded areas denote the detectability probability. The red area shows where the newly detected companions should be located (Martioli et al. 2021).
Current usage metrics show cumulative count of Article Views (full-text article views including HTML views, PDF and ePub downloads, according to the available data) and Abstracts Views on Vision4Press platform.
Data correspond to usage on the plateform after 2015. The current usage metrics is available 48-96 hours after online publication and is updated daily on week days.
Initial download of the metrics may take a while.