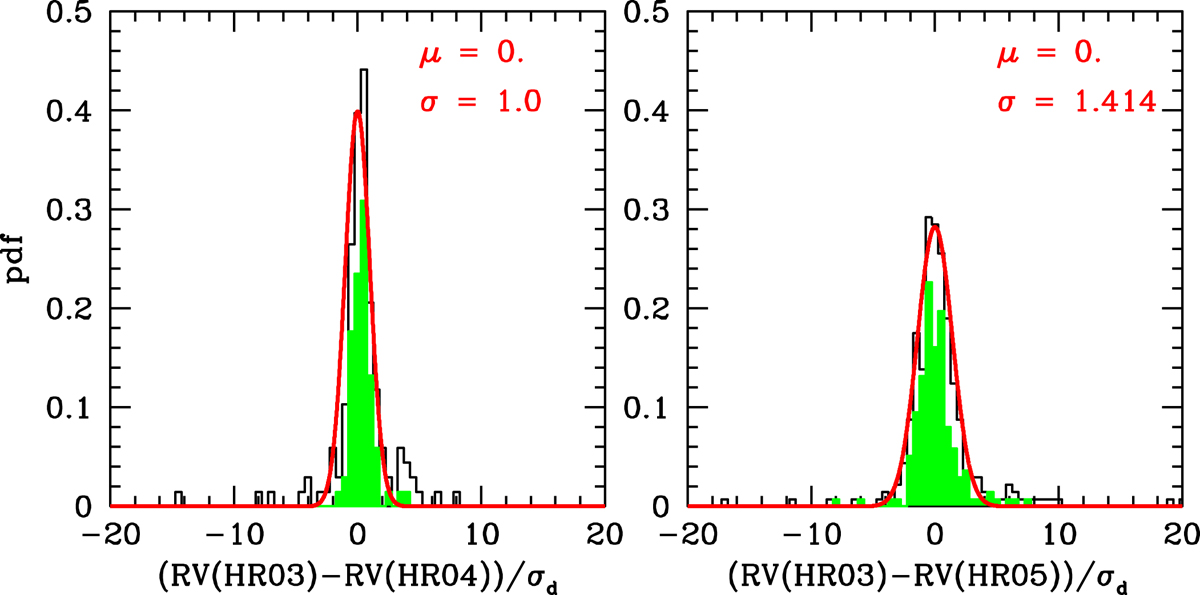
Fig. 5.
Download original image
Histograms of the normalised difference RV(HR03)–RV(HR04) (left panel) and RV(HR03)–RV(HR05) (right panel) for all the pairs. All the objects are included in the black histograms. The green histograms only include the contemporaneous pairs. The red continuous lines represent a Gaussian PDF of zero mean, μ, and with either unit variance (left panel) or σ = 1.414 (right panel). GES 10352851–5812496 is off scale in the right panel.
Current usage metrics show cumulative count of Article Views (full-text article views including HTML views, PDF and ePub downloads, according to the available data) and Abstracts Views on Vision4Press platform.
Data correspond to usage on the plateform after 2015. The current usage metrics is available 48-96 hours after online publication and is updated daily on week days.
Initial download of the metrics may take a while.