Open Access
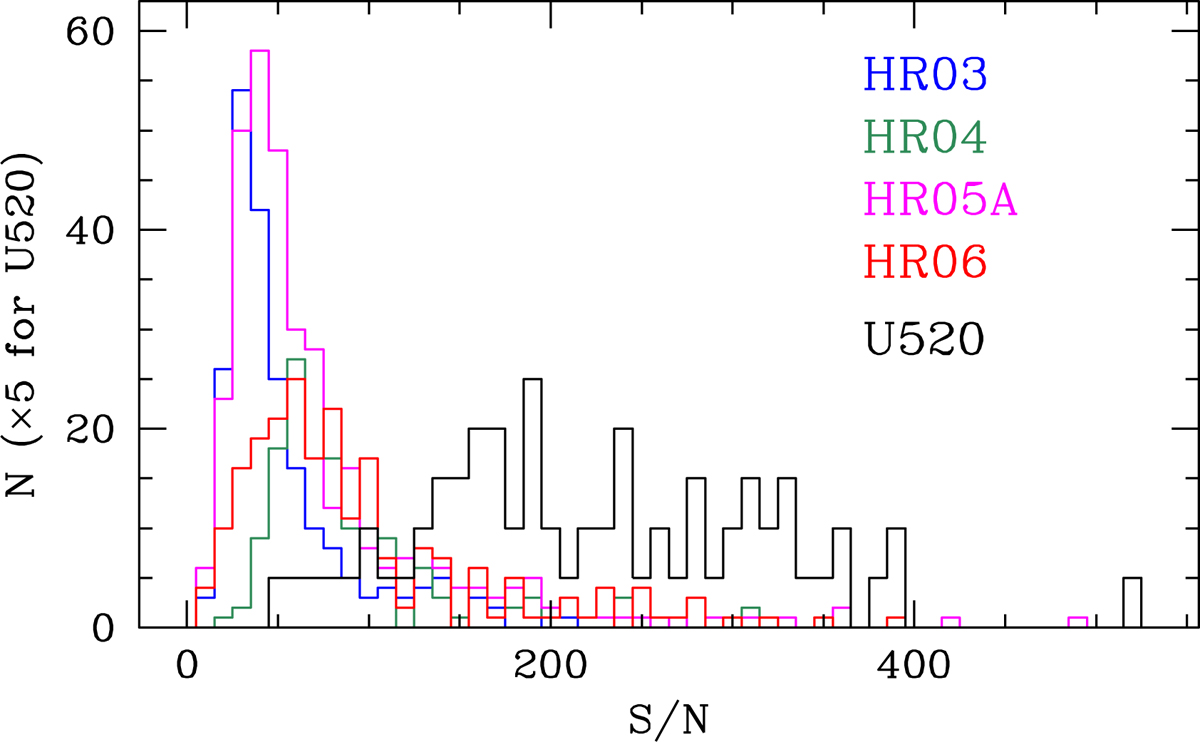
Fig. 4.
Download original image
Breakdown of the mean S/N of the epoch spectra. The S/N is computed by the GES and refers to the value averaged across the entire wavelength range. The histogram for U520 is multiplied by five for better visibility.
Current usage metrics show cumulative count of Article Views (full-text article views including HTML views, PDF and ePub downloads, according to the available data) and Abstracts Views on Vision4Press platform.
Data correspond to usage on the plateform after 2015. The current usage metrics is available 48-96 hours after online publication and is updated daily on week days.
Initial download of the metrics may take a while.