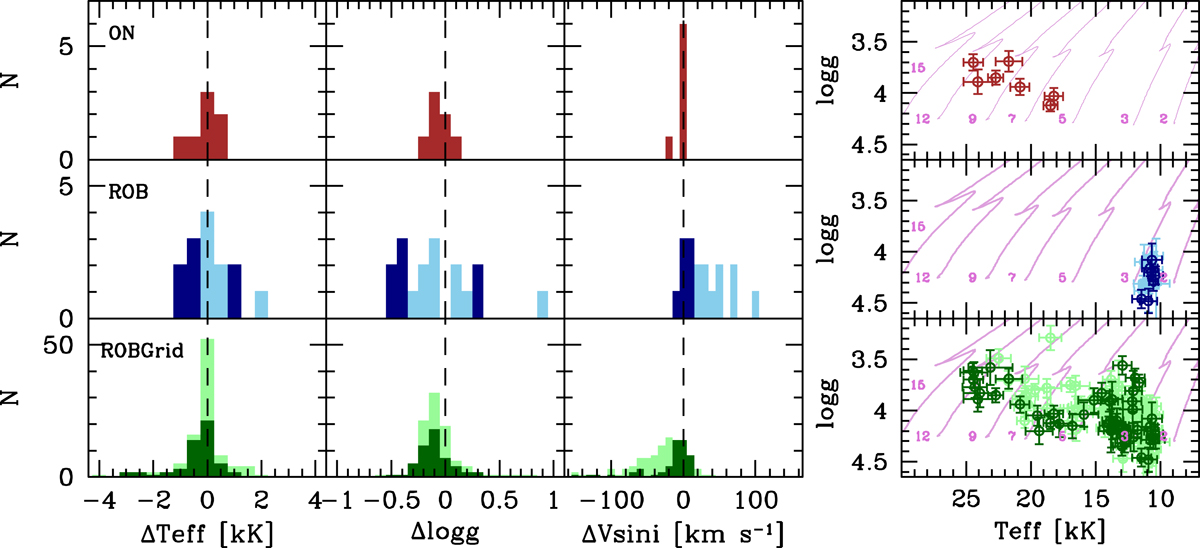
Fig. E.3.
Download original image
Comparison with the results of other WG13 nodes. Left panels: differences between the stellar parameters expressed as this study minus other node. In each panel, fast rotators for which we estimate V sin i above 150 km s−1 are indicated by lighter colours. Only one colour is used for the ON node because only slow rotators below that threshold were analysed. Right panels: position of each sub-sample in a Kiel diagram based on our parameters. Theoretical evolutionary tracks at solar metallicity and with ωinit = 0.8 (see Sect. 6 for definition) are overlaid (Georgy et al. 2013). The initial stellar mass (in solar units) is indicated.
Current usage metrics show cumulative count of Article Views (full-text article views including HTML views, PDF and ePub downloads, according to the available data) and Abstracts Views on Vision4Press platform.
Data correspond to usage on the plateform after 2015. The current usage metrics is available 48-96 hours after online publication and is updated daily on week days.
Initial download of the metrics may take a while.