Fig. 2.
Download original image
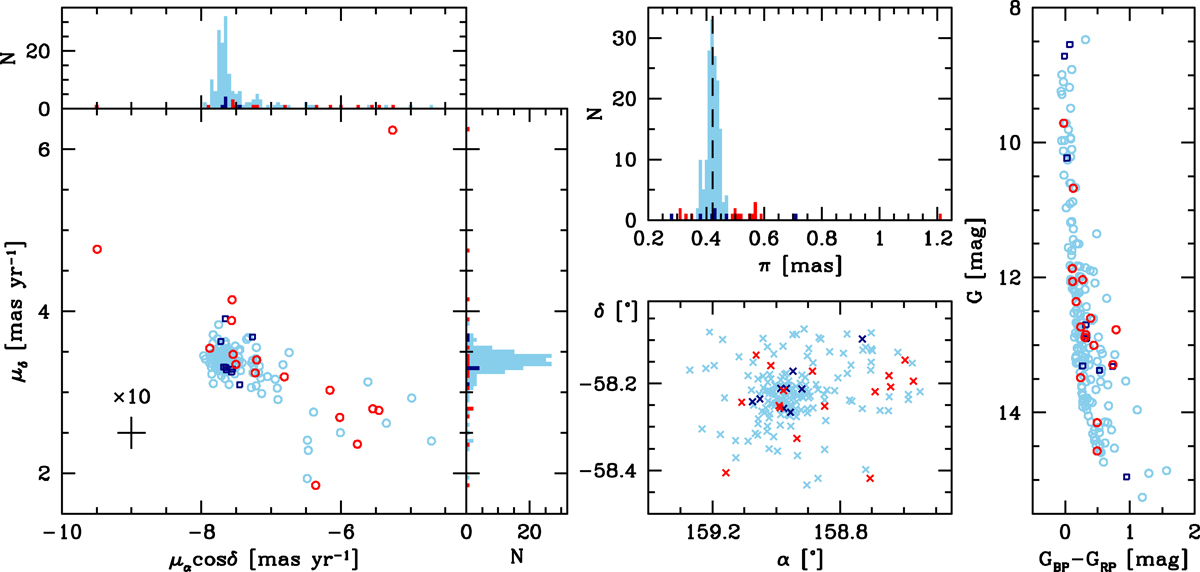
Astrometric and photometric properties of our sample. Red symbols highlight in all panels stars assumed not to be cluster members, while dark blue symbols indicate stars with possible issues with the Gaia EDR3 data. Left panels: proper motions. A typical error bar with a size multiplied by ten is shown. Top middle panel: parallax distribution. The dashed line shows our mean value. Bottom middle panel: coordinates (epoch J2000). Right panel: CMD.
Current usage metrics show cumulative count of Article Views (full-text article views including HTML views, PDF and ePub downloads, according to the available data) and Abstracts Views on Vision4Press platform.
Data correspond to usage on the plateform after 2015. The current usage metrics is available 48-96 hours after online publication and is updated daily on week days.
Initial download of the metrics may take a while.