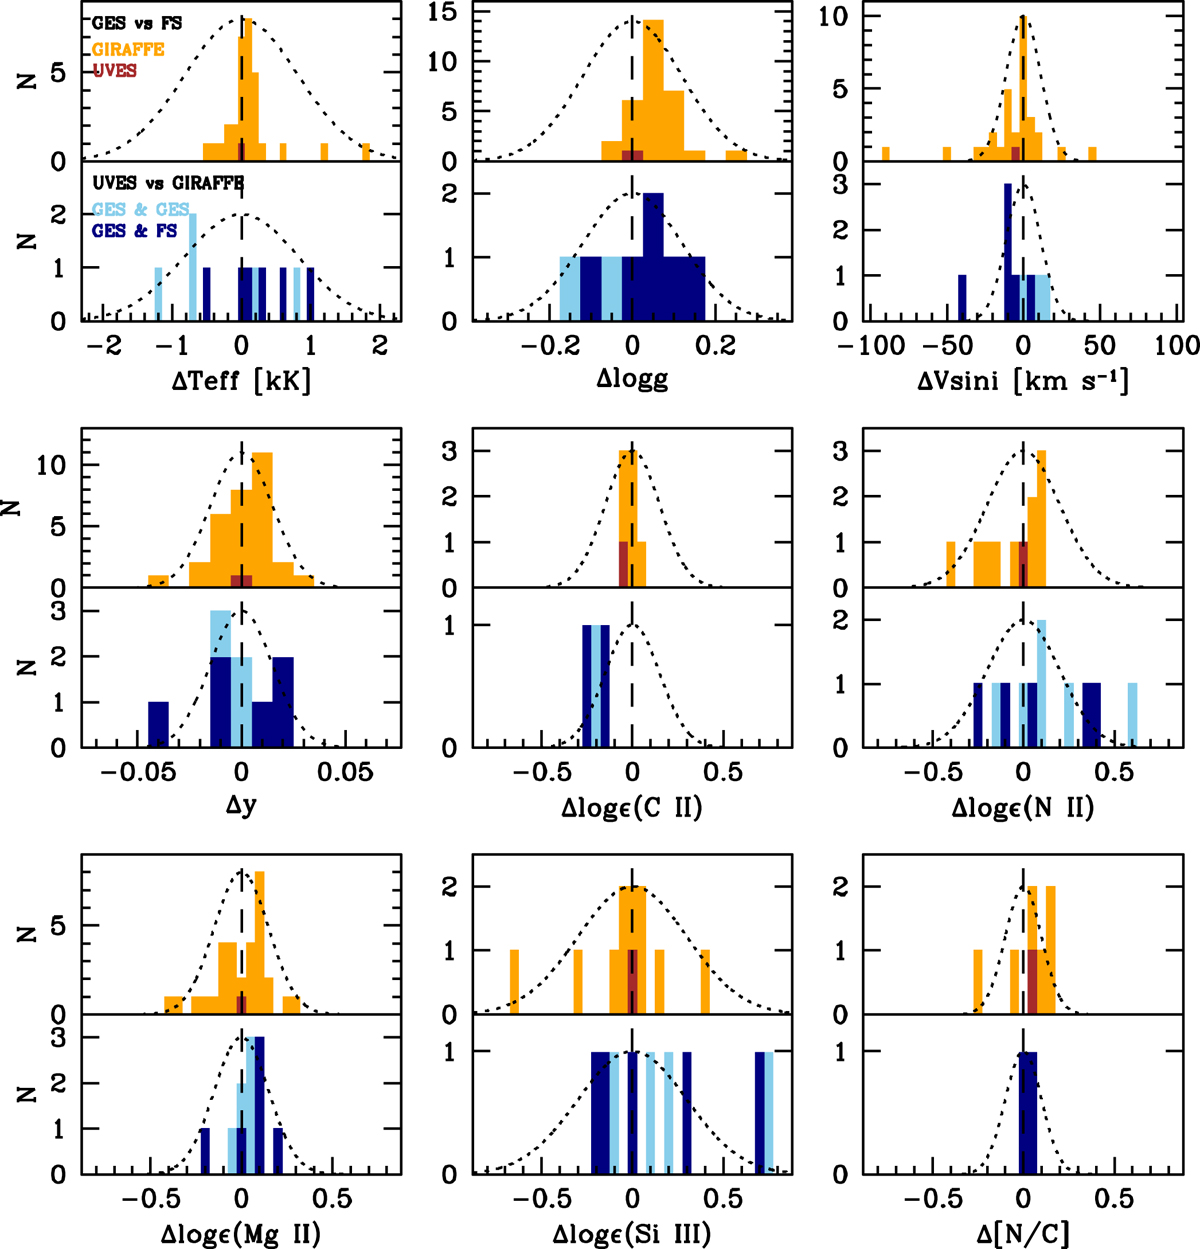
Fig. E.1.
Download original image
Comparison of results from repeated observations. Top panel of each sub-figure: differences between the results obtained using GES or FS data based on either GIRAFFE or UVES. Bottom panel of each sub-figure: differences between the results obtained using either UVES or GIRAFFE data. Two cases are considered: only GES data or observations taken from a different source (FS or GES). All the differences are expressed as GES minus FS and UVES minus GIRAFFE. The dotted curve is a normal distribution with a variance set to the nominal random uncertainty.
Current usage metrics show cumulative count of Article Views (full-text article views including HTML views, PDF and ePub downloads, according to the available data) and Abstracts Views on Vision4Press platform.
Data correspond to usage on the plateform after 2015. The current usage metrics is available 48-96 hours after online publication and is updated daily on week days.
Initial download of the metrics may take a while.