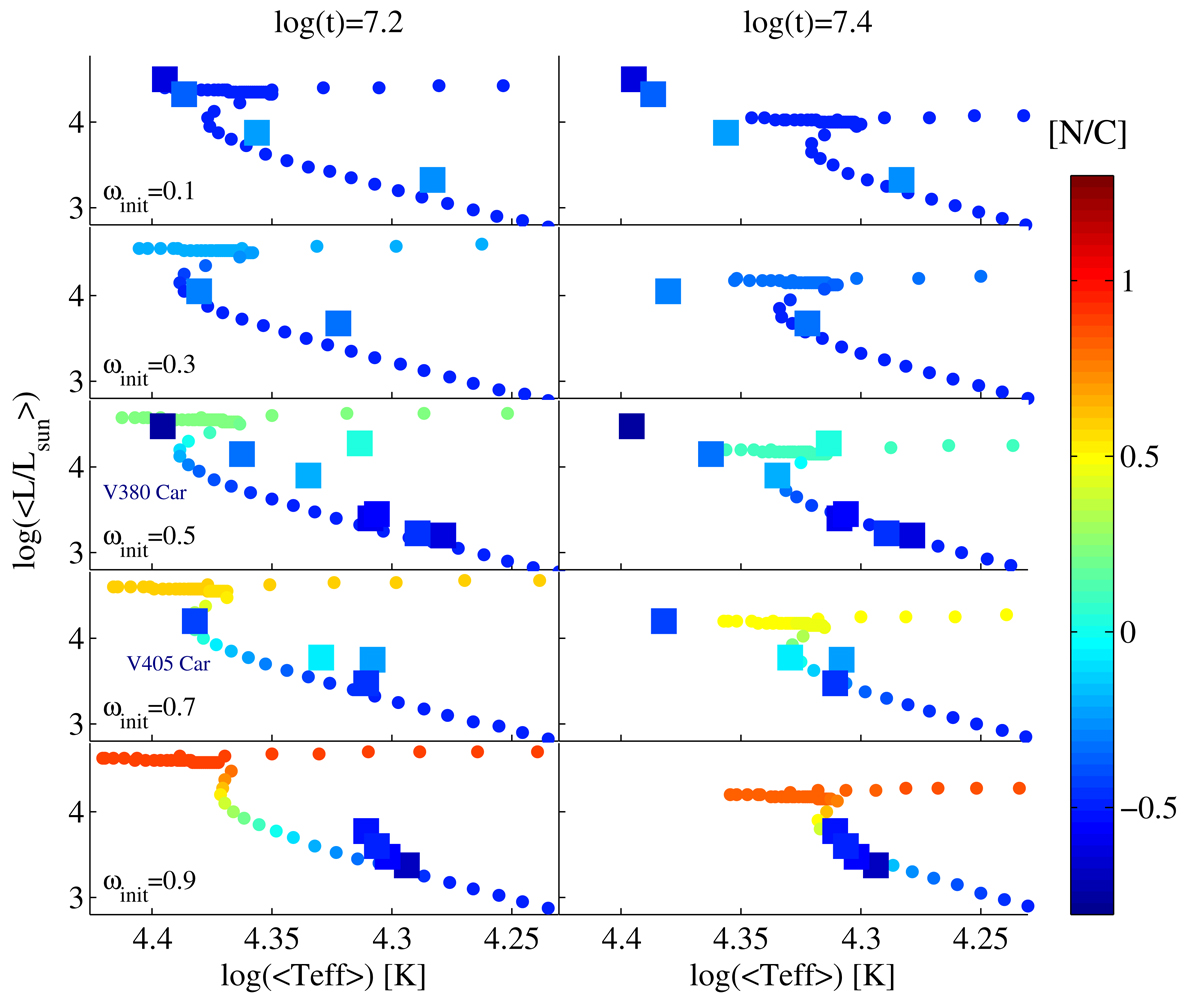
Fig. 15.
Download original image
Comparison in a HR diagram between the [N/C] data (squares) and the predictions (circles) of solar-metallicity evolutionary models for various initial rotation rates and two cluster ages: log(t) = 7.2 (left panels) and 7.4 (right panels). The model predictions are taken from Georgy et al. (2013). The stars selected in each panel fulfil the condition |ω − ωinit| < 0.1. The observational error bars are smaller than the square symbols. The [N/C] abundance ratio is colour coded. The stars V380 Car – and to a lesser extent V405 Car – whose observations are at odds with the model predictions are indicated.
Current usage metrics show cumulative count of Article Views (full-text article views including HTML views, PDF and ePub downloads, according to the available data) and Abstracts Views on Vision4Press platform.
Data correspond to usage on the plateform after 2015. The current usage metrics is available 48-96 hours after online publication and is updated daily on week days.
Initial download of the metrics may take a while.