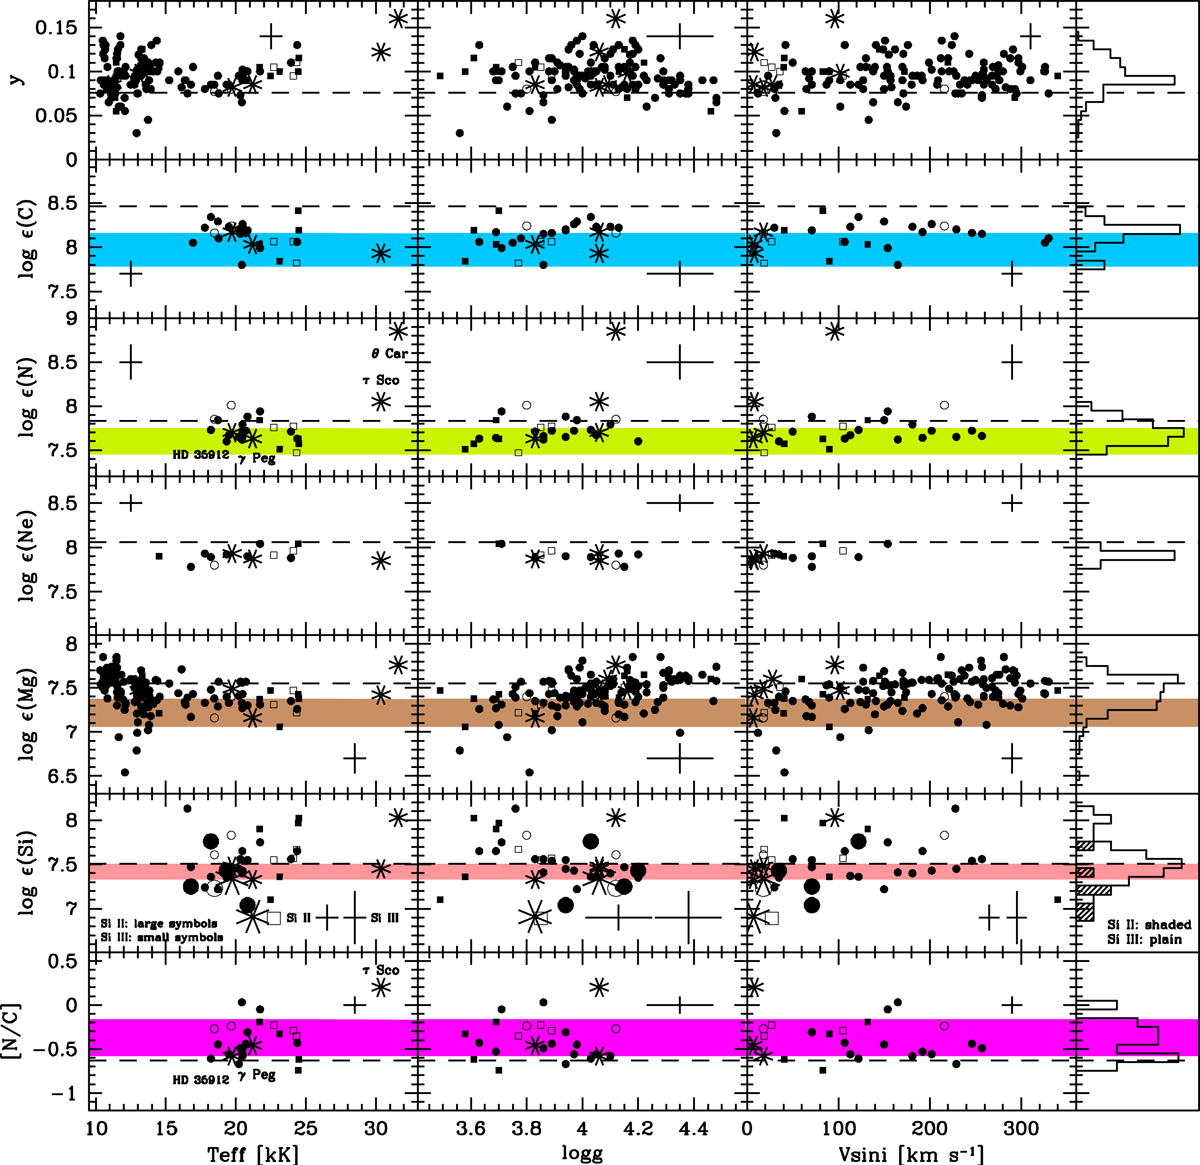
Fig. 12.
Download original image
Variations of the abundances as a function of the apparent stellar parameters. Non cluster-members (Sect. 3.3) were excluded. Stars with or without a binary flag are shown with open and filled symbols, respectively. Stars flagged or not as line-profile variables are plotted as squares and circles, respectively. For both variability types, a confidence level ‘A’ or ‘B’ is required. The benchmarks are shown with star symbols (for convenience, the position of those discussed in Sect. 7.3 is indicated in the panels showing the behaviour of the N and [N/C] abundances as a function of Teff). Crosses show illustrative error bars. The Si II and Si III data are plotted together in the same panels. The horizontal, dashed line indicates the solar abundance (Asplund et al. 2021), while the horizontal stripe shows the mean values (±1σ) for stars in NGC 3293 determined by Hunter et al. (2009). The values are provided in Table 6. The rightmost panels show the breakdown of our abundance data for the NGC 3293 sample.
Current usage metrics show cumulative count of Article Views (full-text article views including HTML views, PDF and ePub downloads, according to the available data) and Abstracts Views on Vision4Press platform.
Data correspond to usage on the plateform after 2015. The current usage metrics is available 48-96 hours after online publication and is updated daily on week days.
Initial download of the metrics may take a while.