Fig. 5.
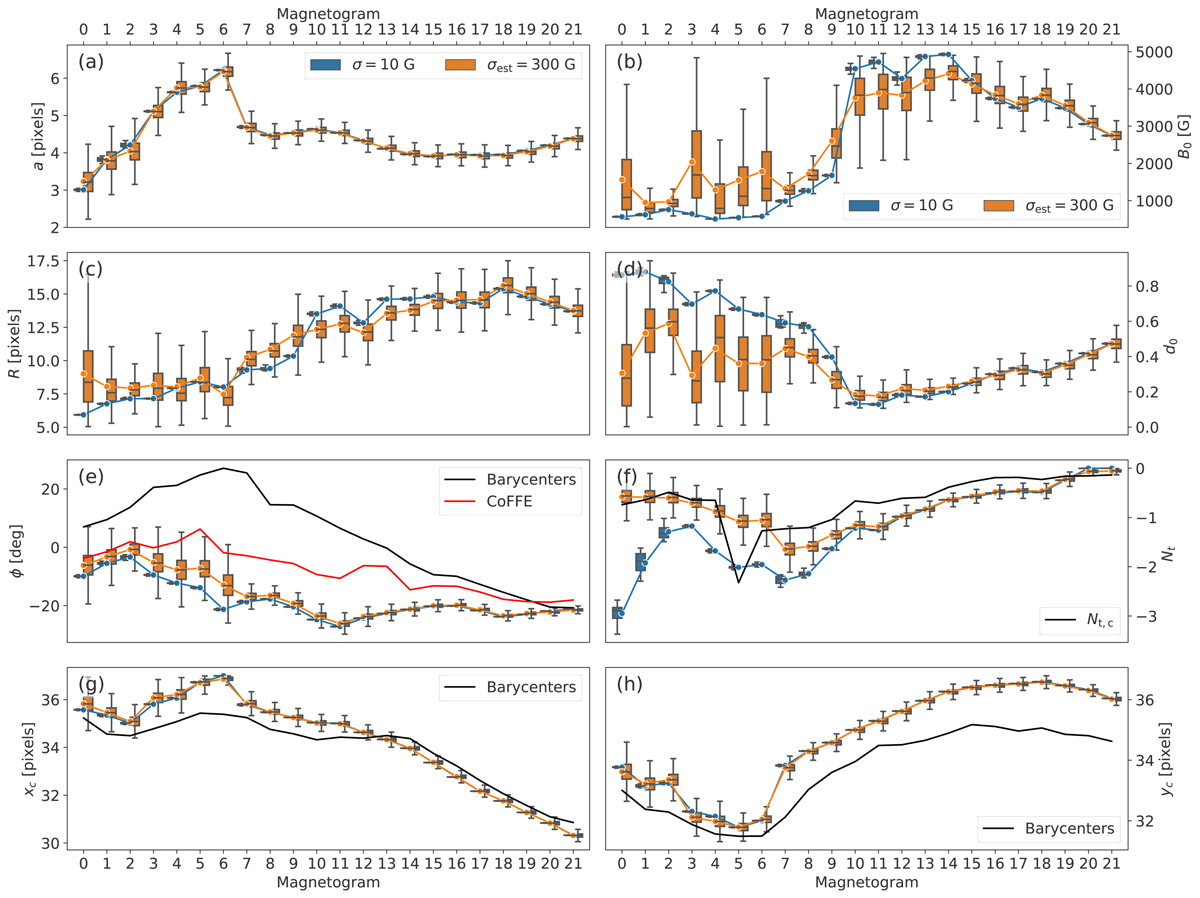
Download original image
Box plots showing the evolution of the marginal posteriors inferred for 22 magnetograms along the emergence of AR 10268. Each panel shows the evolution of the model parameters: (a) a, (b) B0, (c) R, (d) d0, (e) ϕ, (f) Nt, (g) xc, and (h) yc. Blue and orange boxes compare the marginal posteriors obtained using σ = 10 G and σest = 300 G, respectively. The boxes represent the three-quartile values of the distribution (so boxes contain the 50% central part of the distribution) and the whisker extensions are fixed by a factor 1.5 of the inter-quartile range. The blue and orange lines mark the evolution of the mean value of the marginal posteriors for either σ or σest. Panel e: the tilt values obtained using two different methods are added (see inset). The black line in panel f corresponds to the estimation of Nt, c obtained comparing the inclination of the PIL with respect to the direction of the AR bipole. Black lines in panels g and h correspond to the AR barycenter.
Current usage metrics show cumulative count of Article Views (full-text article views including HTML views, PDF and ePub downloads, according to the available data) and Abstracts Views on Vision4Press platform.
Data correspond to usage on the plateform after 2015. The current usage metrics is available 48-96 hours after online publication and is updated daily on week days.
Initial download of the metrics may take a while.