Fig. 4.
Download original image
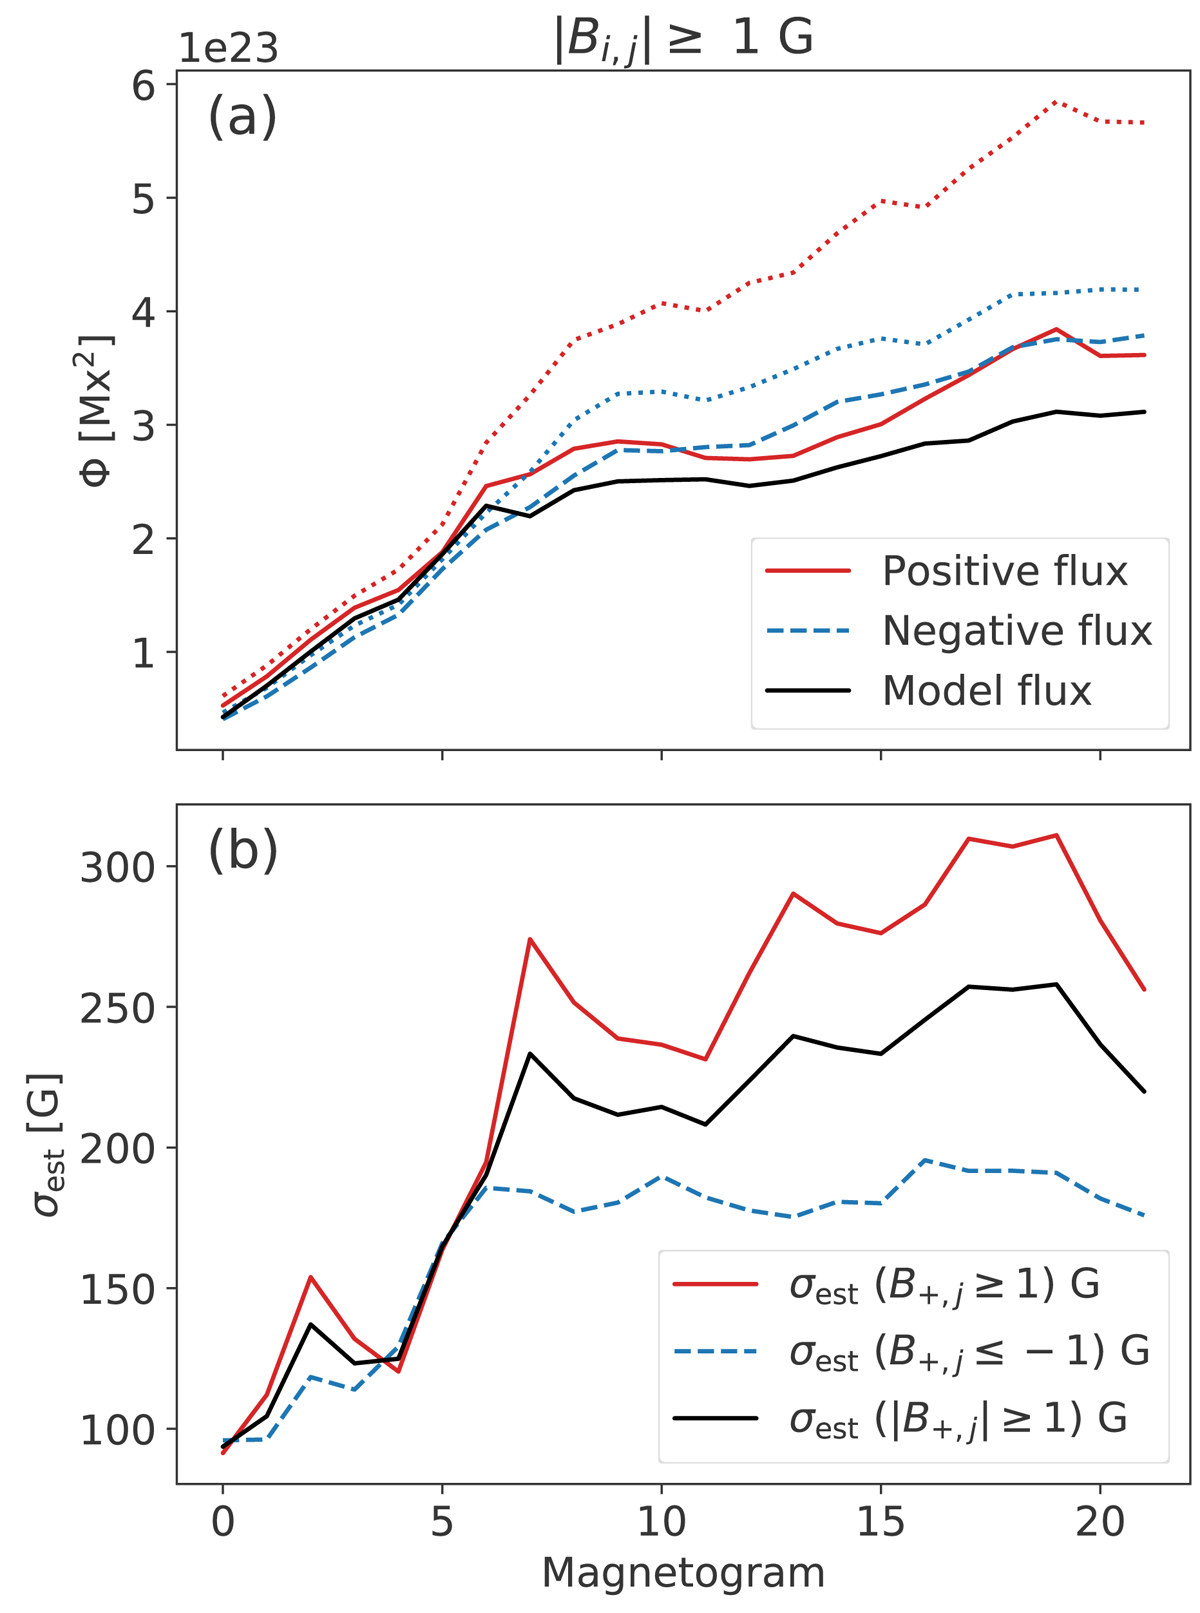
(a) Evolution of AR 10268 magnetic flux. The dotted-red (blue) line shows the evolution of the positive (negative) magnetic flux of the square selection of the magnetogram (as shown in Fig. 1). Solid-red and dashed-blue lines are the positive and negative flux, respectively, computed over the AR field (see Fig. 3c as example). The black line shows the evolution of the most probable model magnetic flux (positive plus absolute value of the negative fluxes divided by two). (b) Estimated value for the standard deviation between model and observations using Eq. (5) over the AR field. The red-solid (blue-dashed) line corresponds to σest for the positive (negative) polarity. The black line corresponds to σest for points within the AR region (|B+, j|≥1 G).
Current usage metrics show cumulative count of Article Views (full-text article views including HTML views, PDF and ePub downloads, according to the available data) and Abstracts Views on Vision4Press platform.
Data correspond to usage on the plateform after 2015. The current usage metrics is available 48-96 hours after online publication and is updated daily on week days.
Initial download of the metrics may take a while.