Fig. 7
Download original image
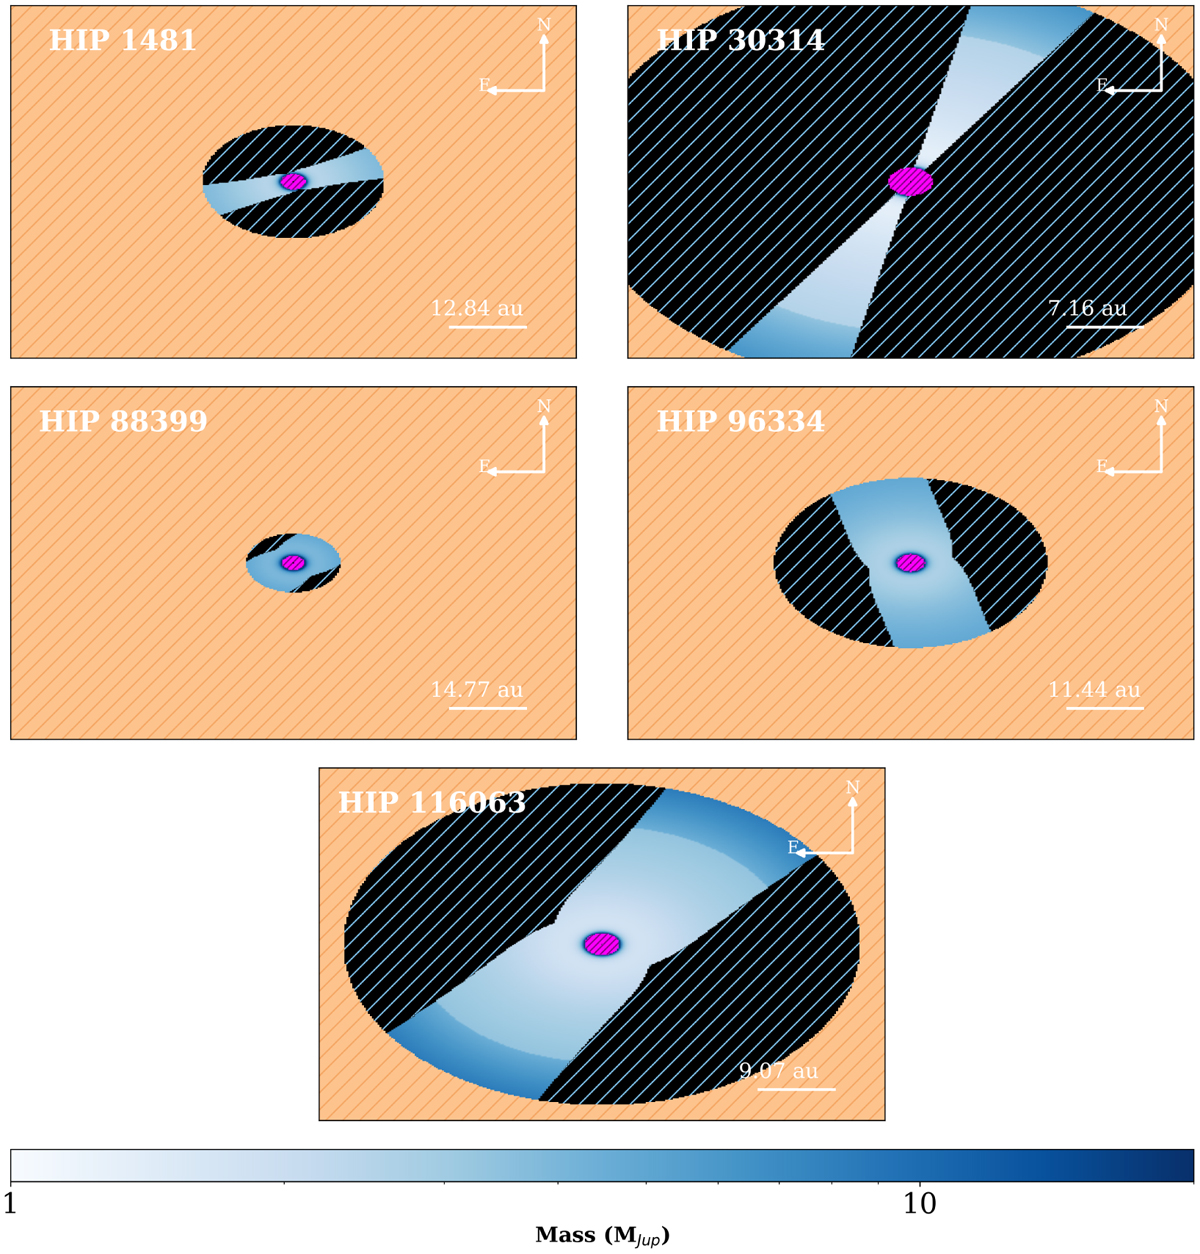
2D maps obtained with FORECAST (for details see Bonavita et al. 2022) showing the sky area compatible with the PMa reported in Table 1 in blue. The intensity of the blue areas changes according to the dynamical mass (in MJup) responsible for the PMa at a given distance; the same logarithmic scale, shown at the bottom of the figure, was used for all stars. The bar shows the separation corresponding to 0.3″, expressed in au using the distance of each system. The dashed areas show the regions excluded due to incompatibility with the PMa (black) and using the limits from direct imaging (orange) and radial velocity (purple), respectively (see Fig. 6).
Current usage metrics show cumulative count of Article Views (full-text article views including HTML views, PDF and ePub downloads, according to the available data) and Abstracts Views on Vision4Press platform.
Data correspond to usage on the plateform after 2015. The current usage metrics is available 48-96 hours after online publication and is updated daily on week days.
Initial download of the metrics may take a while.