Fig. 6
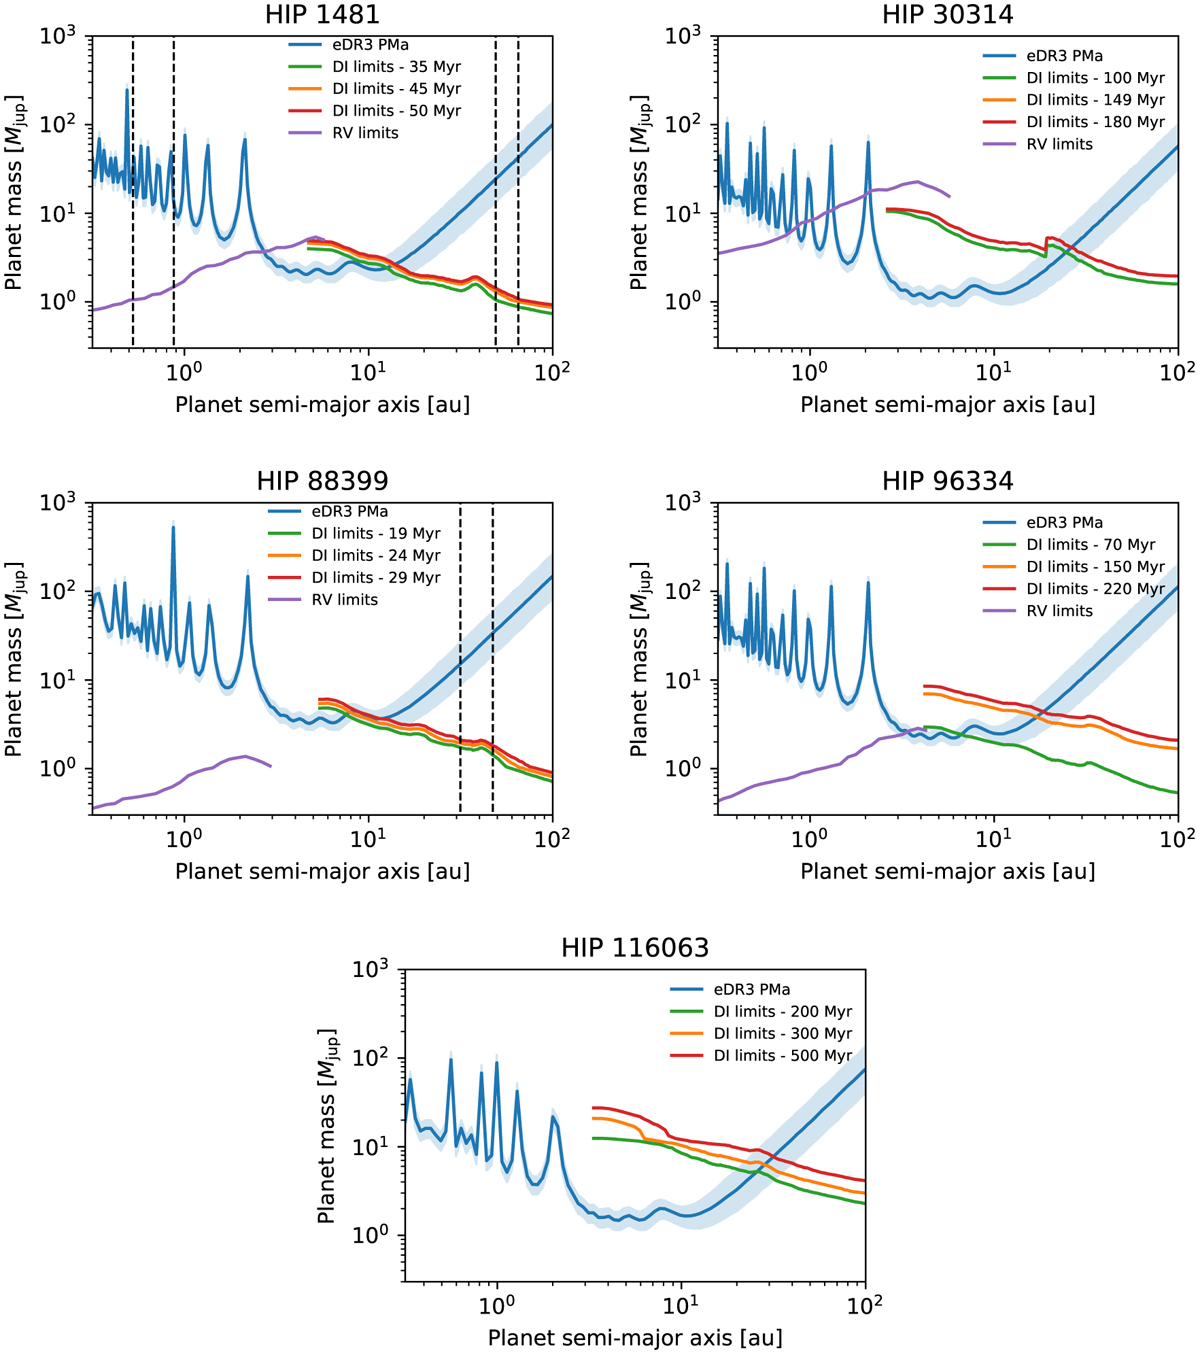
Download original image
Plots of the mass as function of the separation from the host star of the companion needed to explain the PMa measurement at the Gaia eDR3 epoch (blue lines) for HIP 1481 (top left panel), HIP 30314 (top right panel), HIP 88399 (center left panel), HIP 96334 (center right panel), and HIP 116063 (bottom panel). The blue shaded areas display the 1σ confidence interval. The violet lines represent the mass limits from RV data (assuming 95% confidence level). The DI mass limits assuming minimum, expected, and maximum ages are shown by the green, orange, and red lines, respectively. Finally, for HIP 1481 and HIP 88399, we also included the positions of the belts (two in the cases of HIP 1481) composing the debris disk detected around these stars. They are indicated by black dashed lines.
Current usage metrics show cumulative count of Article Views (full-text article views including HTML views, PDF and ePub downloads, according to the available data) and Abstracts Views on Vision4Press platform.
Data correspond to usage on the plateform after 2015. The current usage metrics is available 48-96 hours after online publication and is updated daily on week days.
Initial download of the metrics may take a while.