Fig. 5
Download original image
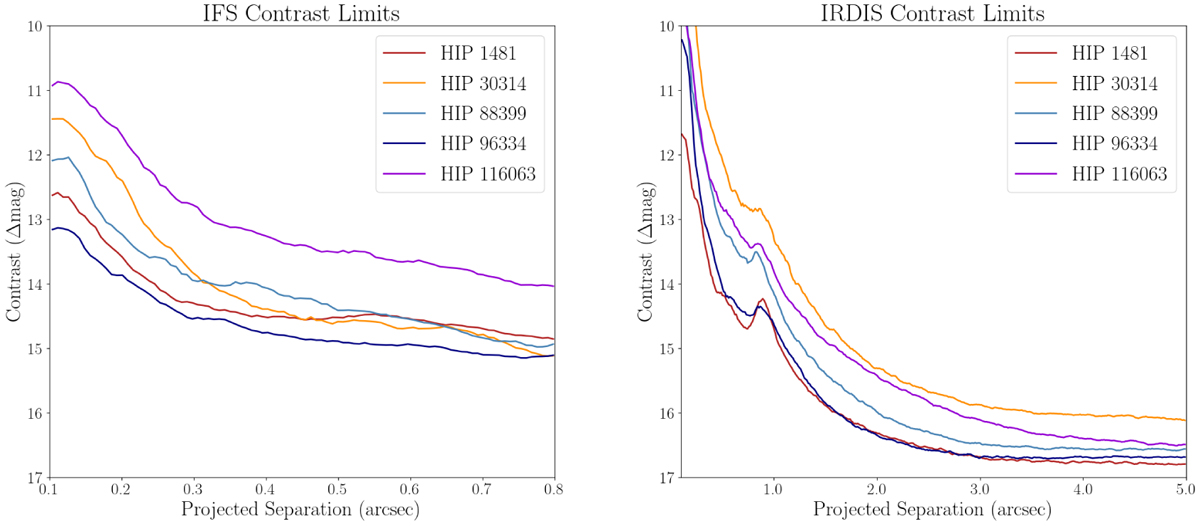
Contrast limits, expressed in magnitude, obtained for all of our targets for IFS (left panel) and IRDIS (right panel) images. In case of multiple epochs, the plotted limit is the one corresponding to the epoch with the best weather conditions. Specifically, the data taken on 18 Sep. 2016 were used for HIP 1481 (red line), and those taken on 11 Apr. 2018 were used for HIP 88399 (light blue line).
Current usage metrics show cumulative count of Article Views (full-text article views including HTML views, PDF and ePub downloads, according to the available data) and Abstracts Views on Vision4Press platform.
Data correspond to usage on the plateform after 2015. The current usage metrics is available 48-96 hours after online publication and is updated daily on week days.
Initial download of the metrics may take a while.