Fig. 9.
Download original image
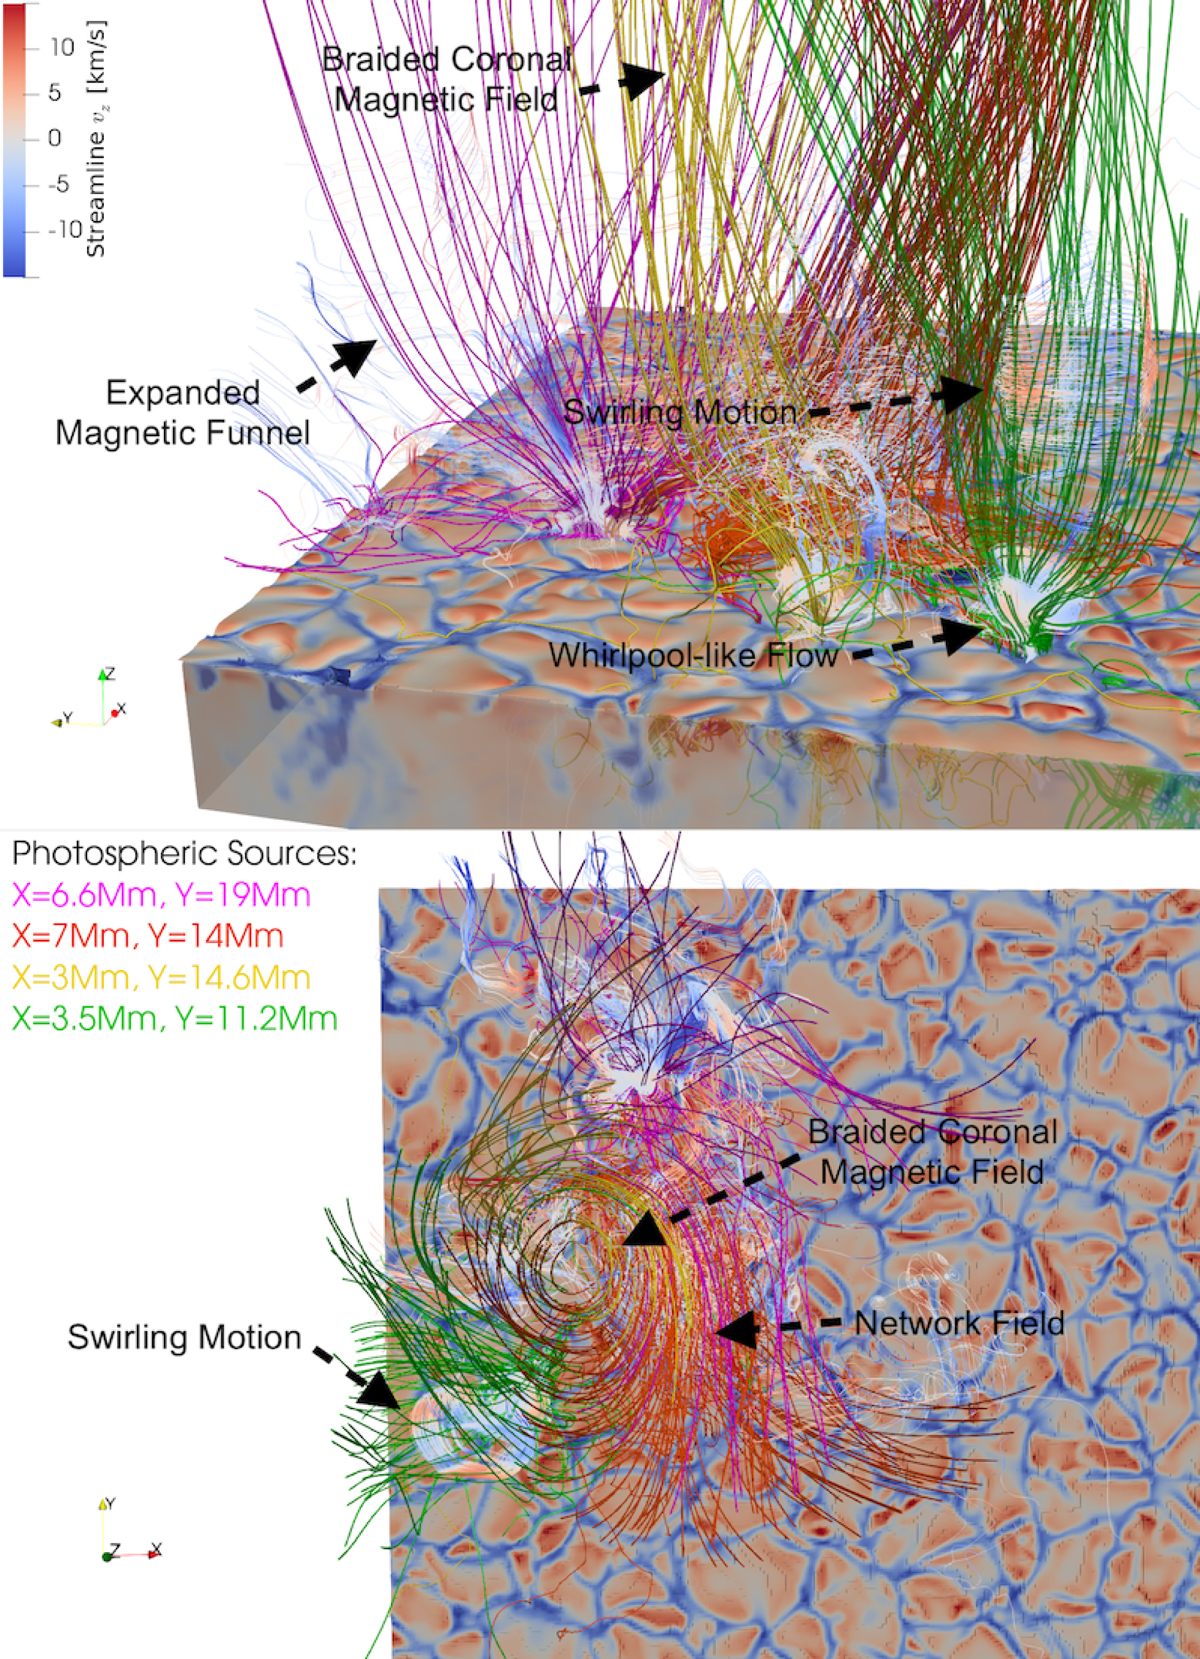
3D visualisation of a subset of the braided coronal magnetic field, at t = 40 min. Magnetic field lines are traced from four photospheric sources (seed points are initiated within 0.25 Mm of the given coordinates). Field lines are coloured by their source location. Streamlines of the velocity field are initiated at the photospheric sources, and are coloured by vertical flow velocity vz. The lower panel shows the same visualisation, now viewed from above.
Current usage metrics show cumulative count of Article Views (full-text article views including HTML views, PDF and ePub downloads, according to the available data) and Abstracts Views on Vision4Press platform.
Data correspond to usage on the plateform after 2015. The current usage metrics is available 48-96 hours after online publication and is updated daily on week days.
Initial download of the metrics may take a while.