Fig. 7.
Download original image
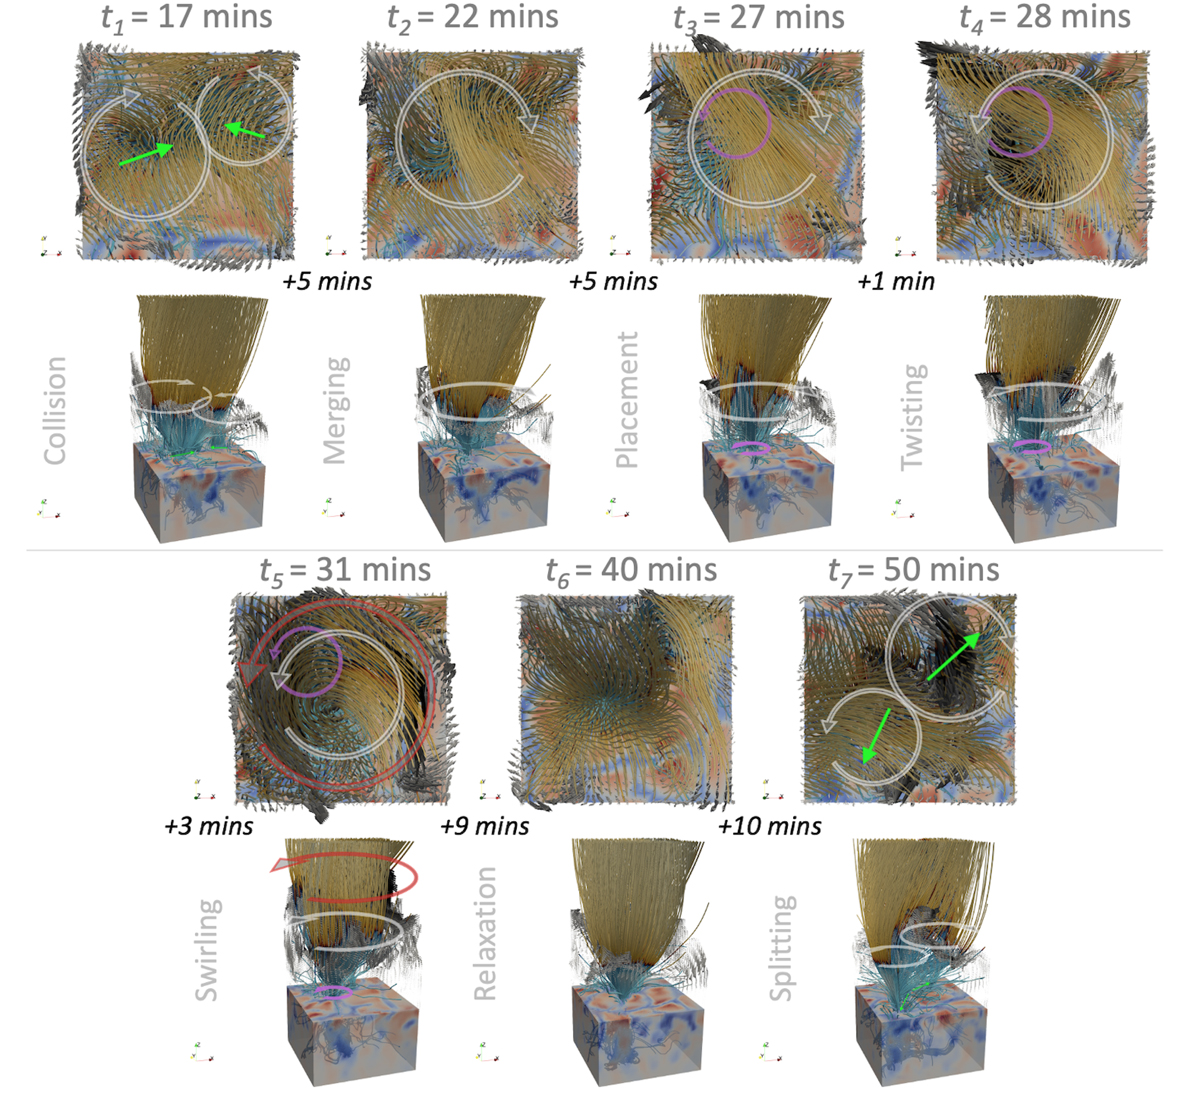
Snapshots during a ∼30 min period that display the merging of two MCs within the intersection of multiple granules, and the subsequent excitation of a SE. A subsection of the computational domain is shown that extends from the bottom boundary up to 6 Mm above the photosphere, with a horizontal extent of 4 Mm × 4 Mm (centred on X = 7 Mm and Y = 19 Mm). A top-down view of the domain is shown above each snapshot. The same cut in the domain is highlighted in Fig. 6. The upper-convection zone is coloured by vertical velocity (red is rising, blue is falling material). Selected magnetic field lines are coloured by temperature as in Fig. 1. The flow velocity in the chromosphere is indicated with arrows, the size and colour of which depend on the magnitude of the local flow speed. Cartoon annotations indicate the direction of advection for the MCs (green) and the important/prevailing flow patterns in the photosphere (magenta), chromosphere (white), and low corona (red).
Current usage metrics show cumulative count of Article Views (full-text article views including HTML views, PDF and ePub downloads, according to the available data) and Abstracts Views on Vision4Press platform.
Data correspond to usage on the plateform after 2015. The current usage metrics is available 48-96 hours after online publication and is updated daily on week days.
Initial download of the metrics may take a while.