Fig. 3.
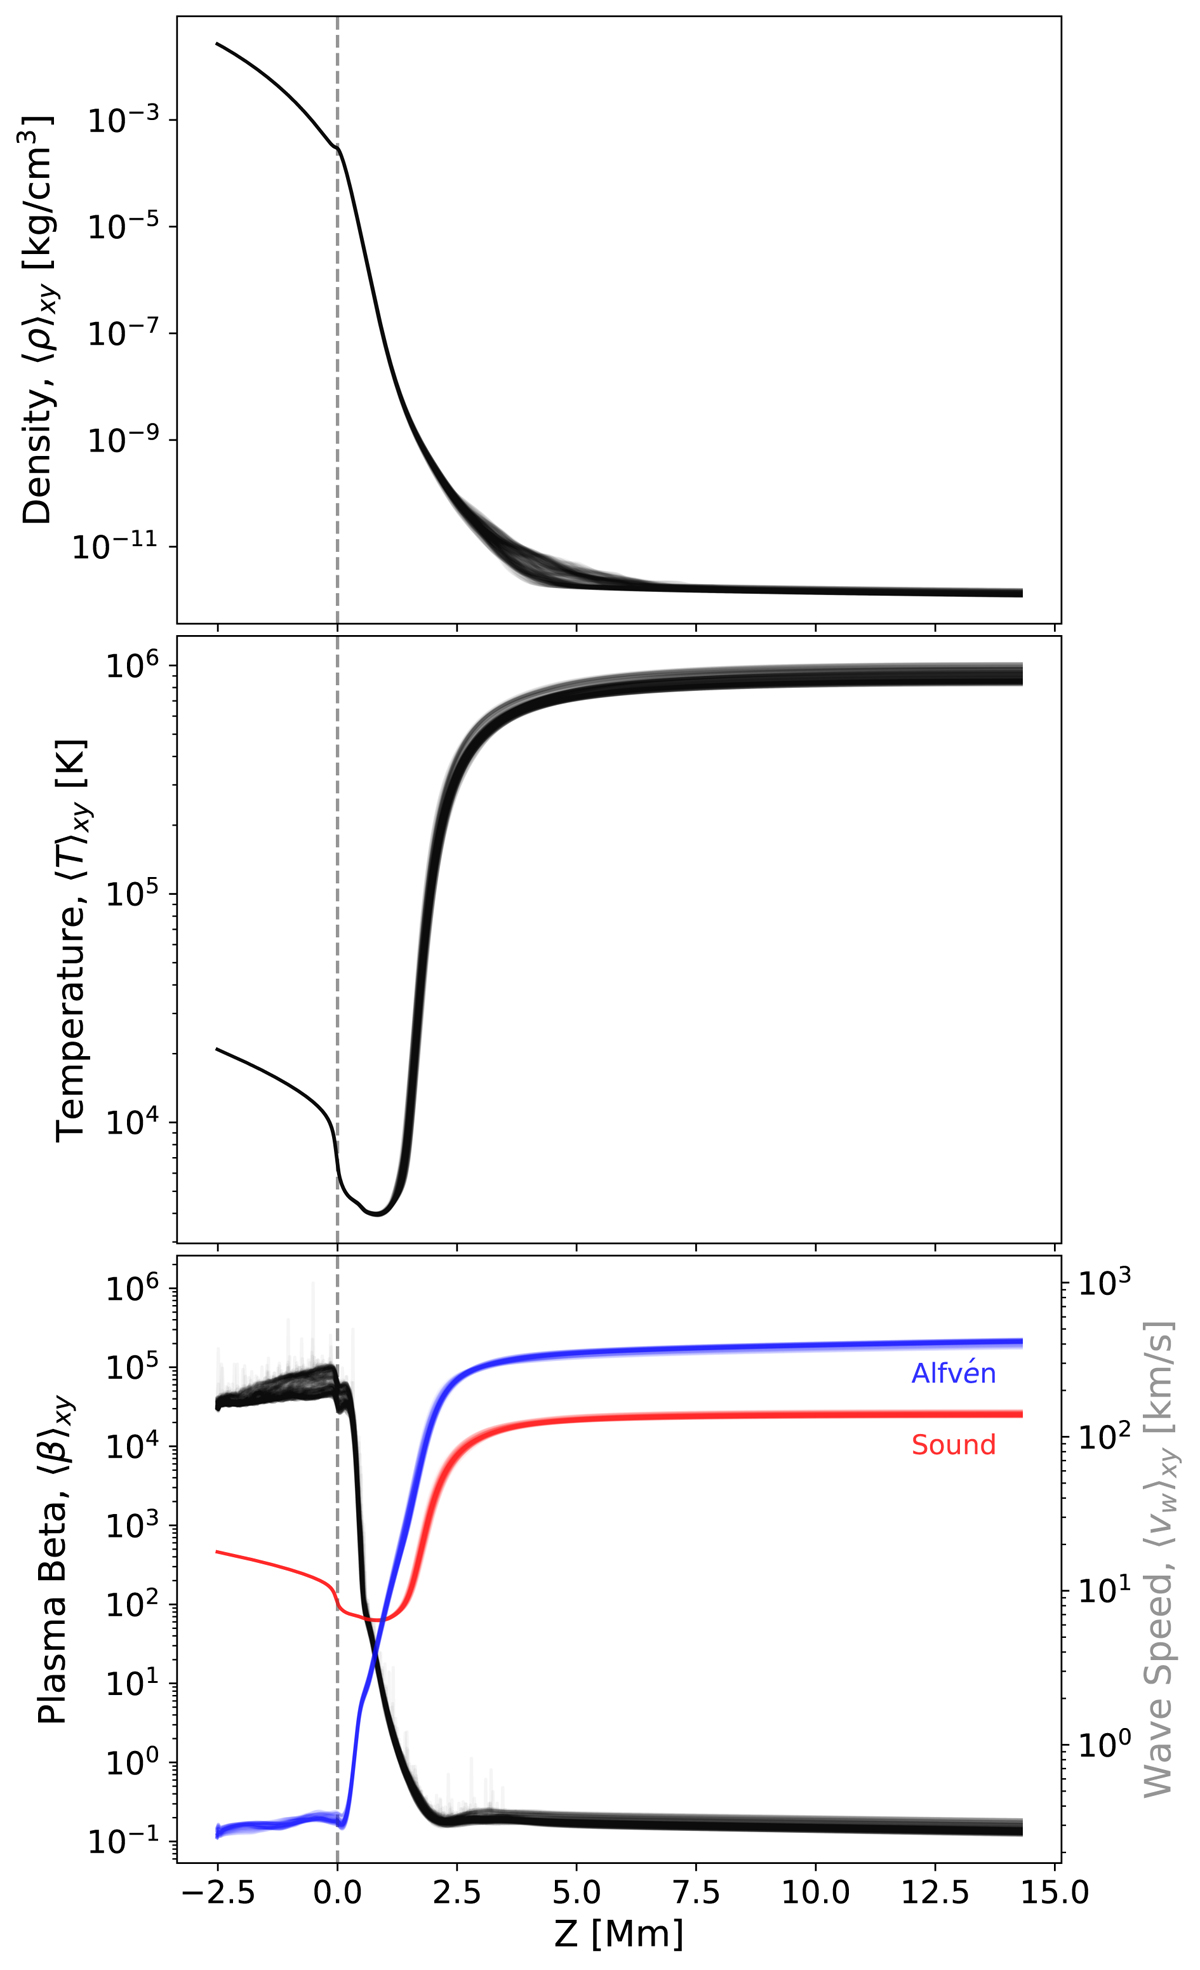
Download original image
Average density (top), temperature (middle), plasma beta, and the sound/Alfvén speeds (bottom) profiles in the simulation domain for each 10 s snapshot during the hour under investigation. Variations in the density above the chromosphere occur due to the launching of jets. Variation in the maximum temperature results from the varying degrees of twisted magnetic structures that facilitate vertical energy transport.
Current usage metrics show cumulative count of Article Views (full-text article views including HTML views, PDF and ePub downloads, according to the available data) and Abstracts Views on Vision4Press platform.
Data correspond to usage on the plateform after 2015. The current usage metrics is available 48-96 hours after online publication and is updated daily on week days.
Initial download of the metrics may take a while.