Fig. A.1.
Download original image
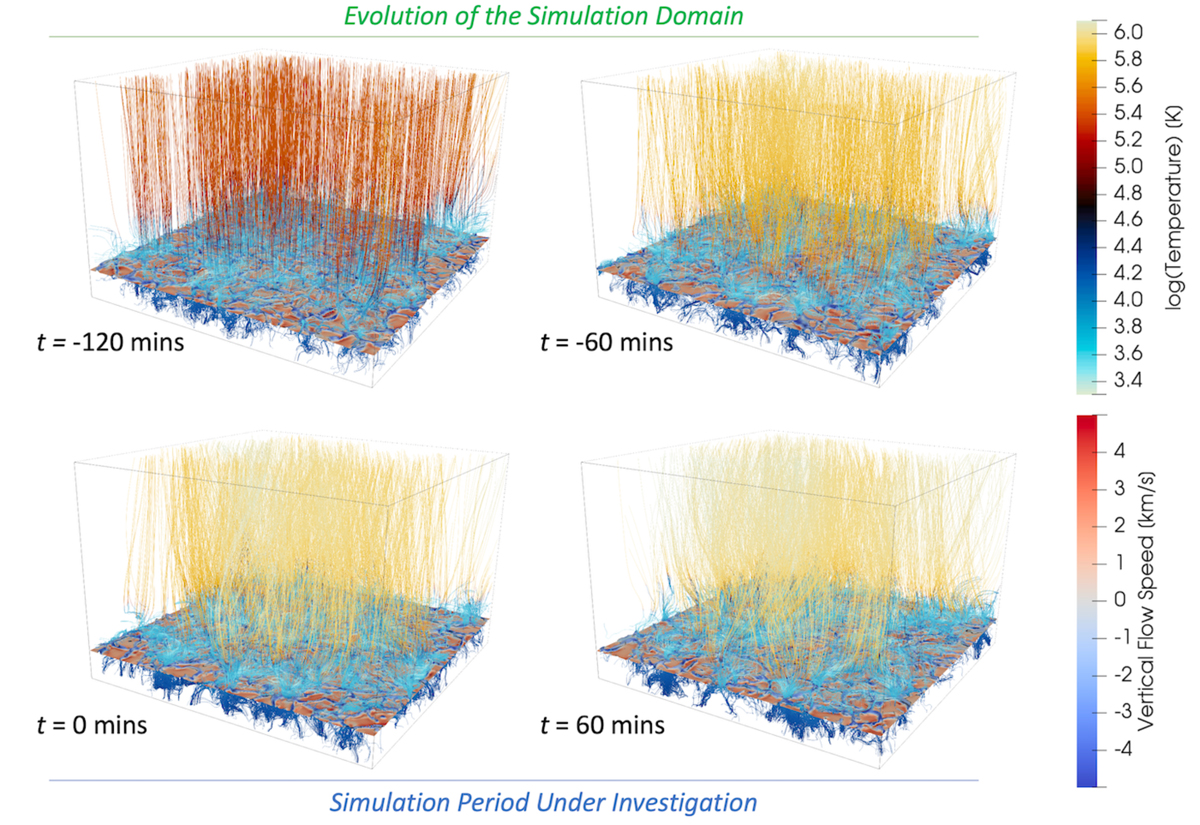
Comparison of the 3D magnetic field and temperature structure in the ch024031_by200bz005 simulation domain in the publicly available dataset (t = 2, 490 − 8, 670 s) and that used in this study (t = 9, 580 − 13, 180 s). The four snapshots are each taken one hour apart (times are given with respect to the start of the hour used in this study). The magnetic field lines are coloured by plasma temperature. The photosphere is indicated in each case, and coloured by the vertical flow speed.
Current usage metrics show cumulative count of Article Views (full-text article views including HTML views, PDF and ePub downloads, according to the available data) and Abstracts Views on Vision4Press platform.
Data correspond to usage on the plateform after 2015. The current usage metrics is available 48-96 hours after online publication and is updated daily on week days.
Initial download of the metrics may take a while.