Open Access
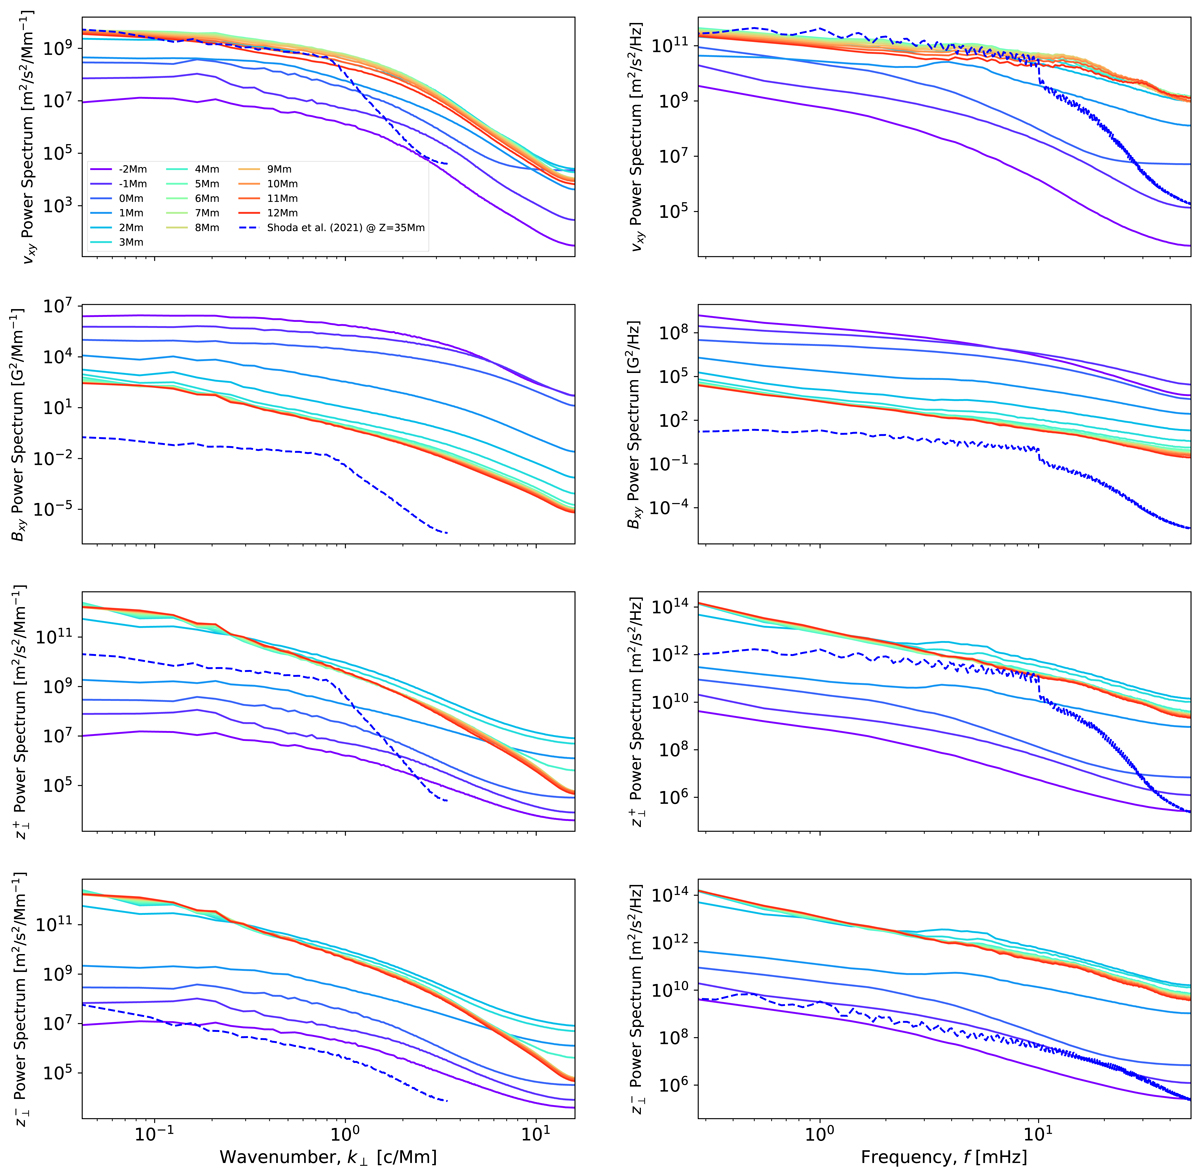
Fig. 20.
Download original image
Power spectra versus wavevector and frequency at various heights in the computational domain for the horizontal flow speed, magnetic field strength, and Elsasser variables. The power spectra from the simulation of Shoda et al. (2021) at a height of Z = 35 Mm are over-plotted for comparison with dashed blue lines.
Current usage metrics show cumulative count of Article Views (full-text article views including HTML views, PDF and ePub downloads, according to the available data) and Abstracts Views on Vision4Press platform.
Data correspond to usage on the plateform after 2015. The current usage metrics is available 48-96 hours after online publication and is updated daily on week days.
Initial download of the metrics may take a while.