Fig. 2.

Download original image
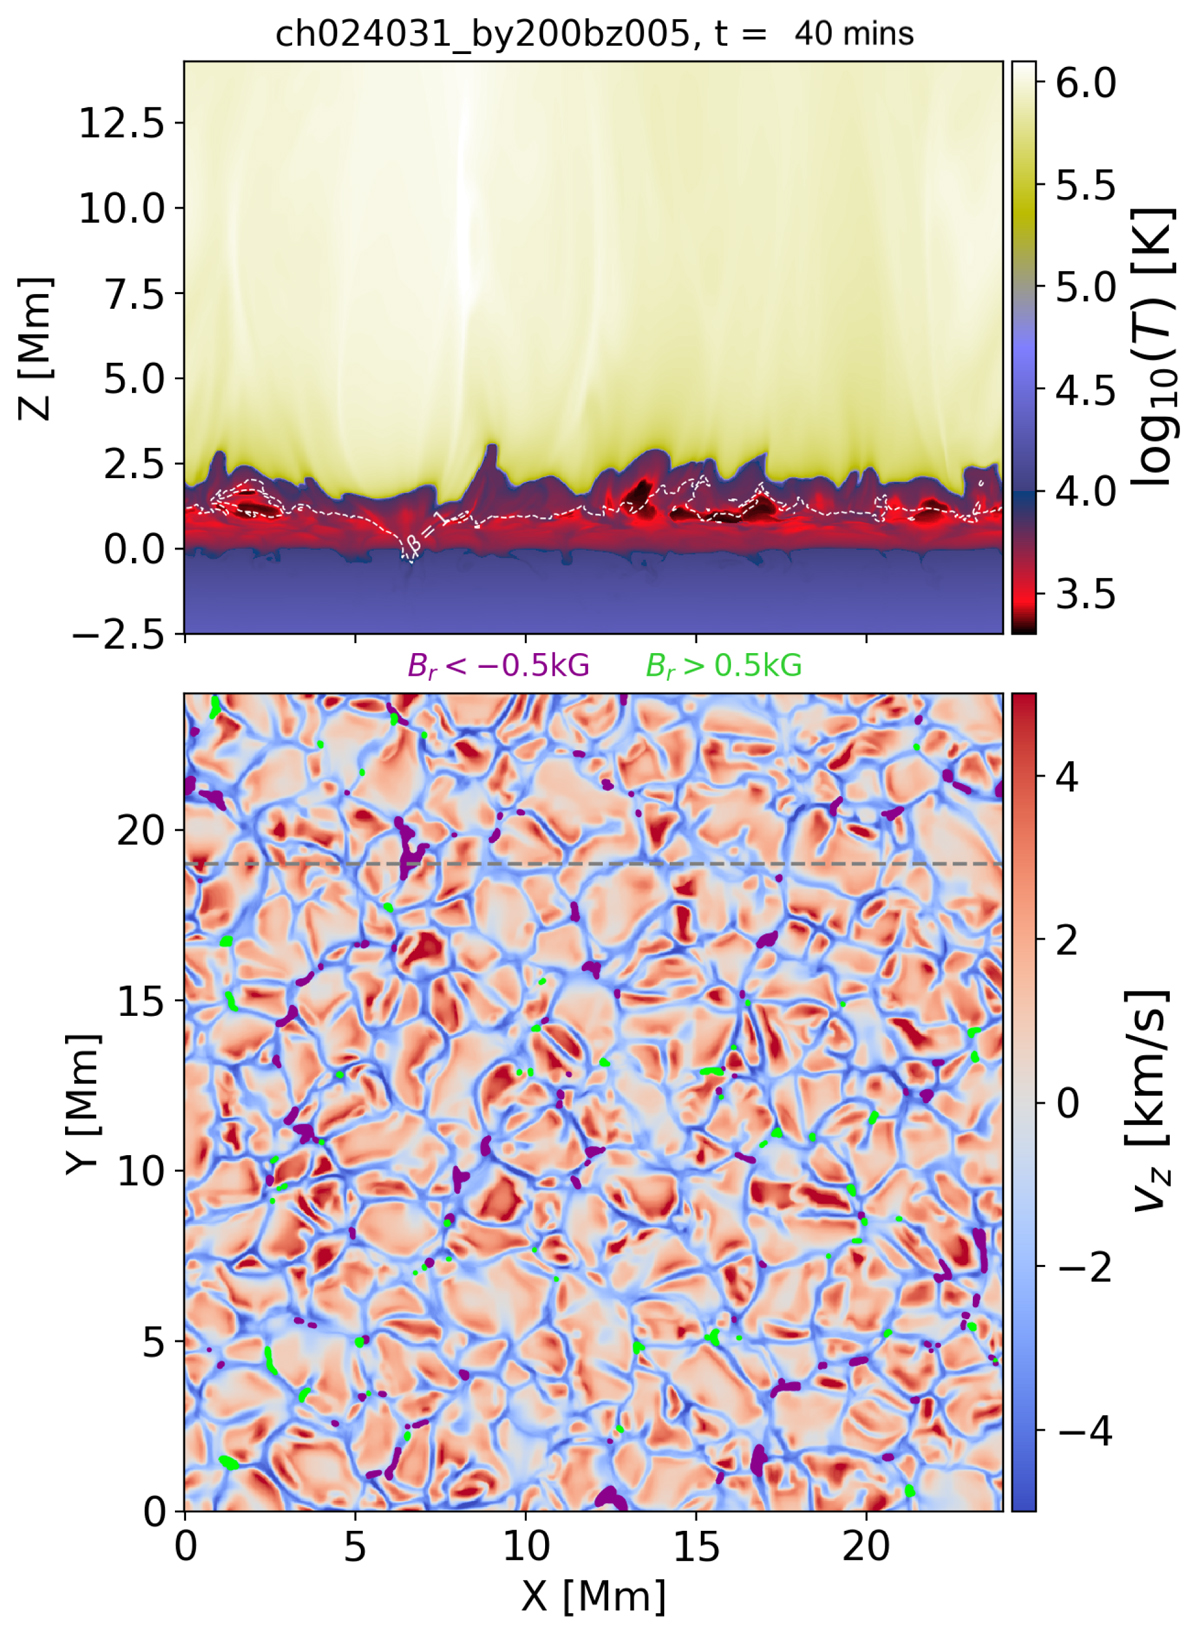
Snapshot of ch024031_by200bz005 at t = 40 min. Top: temperature structure in a vertical cut through the computational domain at Y = 19 Mm (indicated with a dashed line in the lower panel). The plasma β equal to one surface is highlighted with a thin dashed line. Bottom: vertical velocity at the photosphere (Z = 0 Mm). The strongest magnetic field enhancements are highlighted by polarity (purple = negative and green = positive). The field at the photosphere is mostly negative and contained in the intergranular lanes. Data are shown from the same snapshot as Fig. 2.
Current usage metrics show cumulative count of Article Views (full-text article views including HTML views, PDF and ePub downloads, according to the available data) and Abstracts Views on Vision4Press platform.
Data correspond to usage on the plateform after 2015. The current usage metrics is available 48-96 hours after online publication and is updated daily on week days.
Initial download of the metrics may take a while.


