Fig. 19.
Download original image
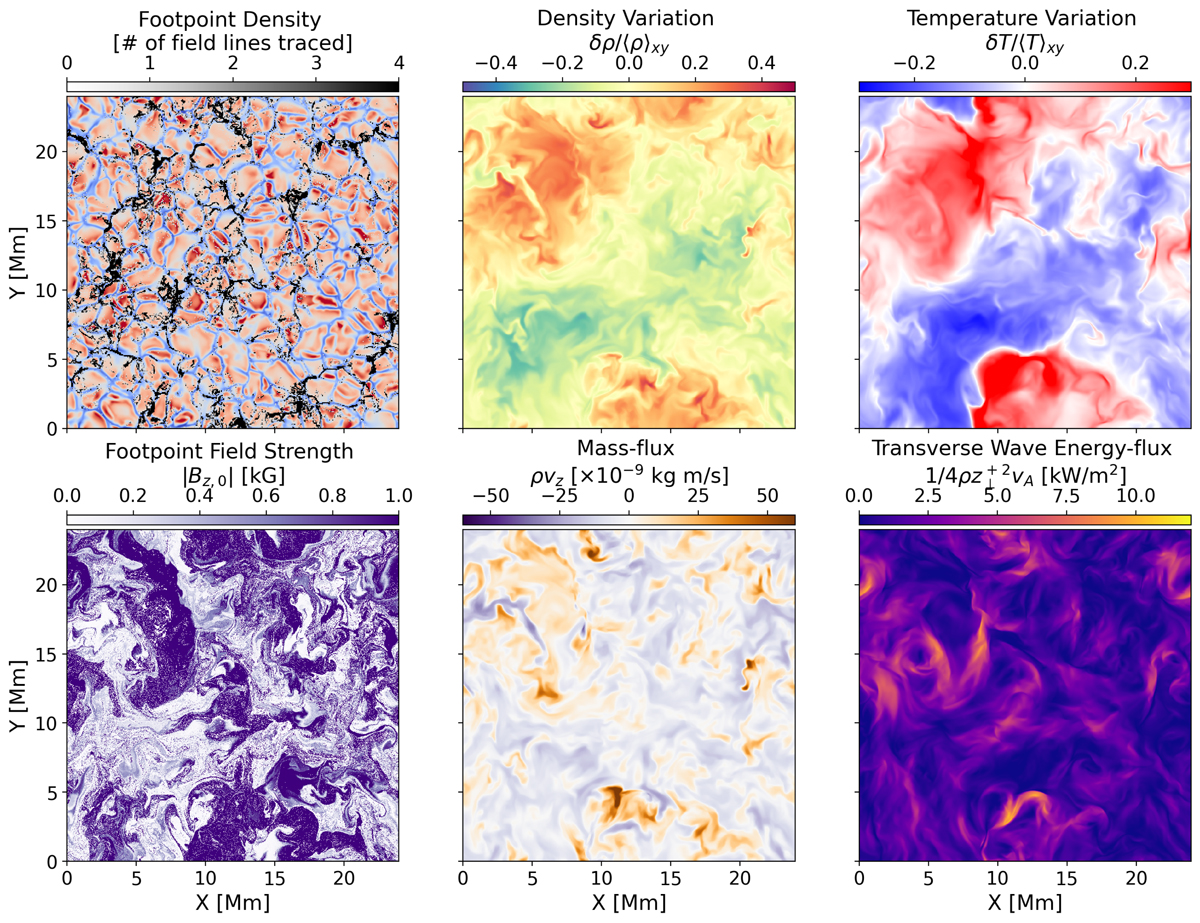
Resulting conditions near the top of the simulation domain (i.e. at the base of the solar wind). Top left: location of the open magnetic field lines at the photosphere (traced down from Z = 12 Mm), with the convection pattern shown bellow. Bottom left: open magnetic field at Z = 12 Mm coloured by their photospheric field strength. Top middle and right: density and temperature variation with respect to the horizontal average at Z = 12 Mm. Bottom middle: mass flux at Z = 12 Mm. Bottom right: transverse wave-energy-flux at Z = 12 Mm. Each panel is taken at t = 40 min. The contrast in density, temperature and upward wave-energy is evident, resulting from the different MC field strengths at the base of the braided magnetic field structures.
Current usage metrics show cumulative count of Article Views (full-text article views including HTML views, PDF and ePub downloads, according to the available data) and Abstracts Views on Vision4Press platform.
Data correspond to usage on the plateform after 2015. The current usage metrics is available 48-96 hours after online publication and is updated daily on week days.
Initial download of the metrics may take a while.