Fig. 18.
Download original image
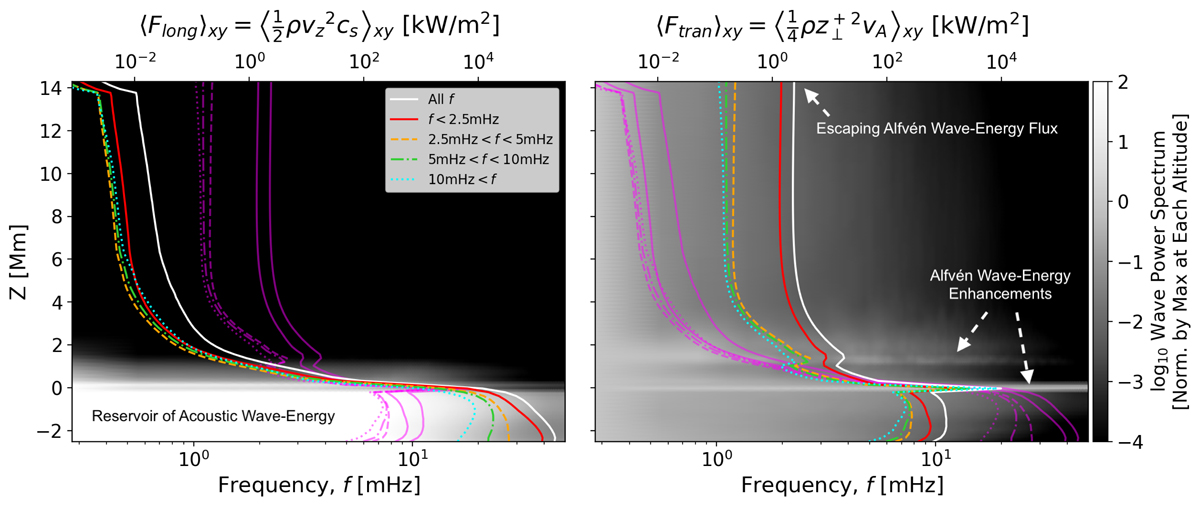
Frequency power spectrum of the longitudinal (acoustic) wave-energy flux Flong (left) and the transverse (Alfvén) wave-energy flux Ftran (right), versus height (in both cases normalised by the maximum transverse PS at each height). Coloured lines are over-plotted showing the average energy flux versus height for four frequency ranges and their total. Grey lines show the other wave flux averages for comparison. The upper-convection zone is a source of both longitudinal and transverse waves, with the longitudinal waves having an energy flux that is 2–3 orders of magnitude larger than the transverse waves. However, the longitudinal wave-energy flux decays exponentially with height. Such that in the low corona, the relative balance of energies is reversed.
Current usage metrics show cumulative count of Article Views (full-text article views including HTML views, PDF and ePub downloads, according to the available data) and Abstracts Views on Vision4Press platform.
Data correspond to usage on the plateform after 2015. The current usage metrics is available 48-96 hours after online publication and is updated daily on week days.
Initial download of the metrics may take a while.