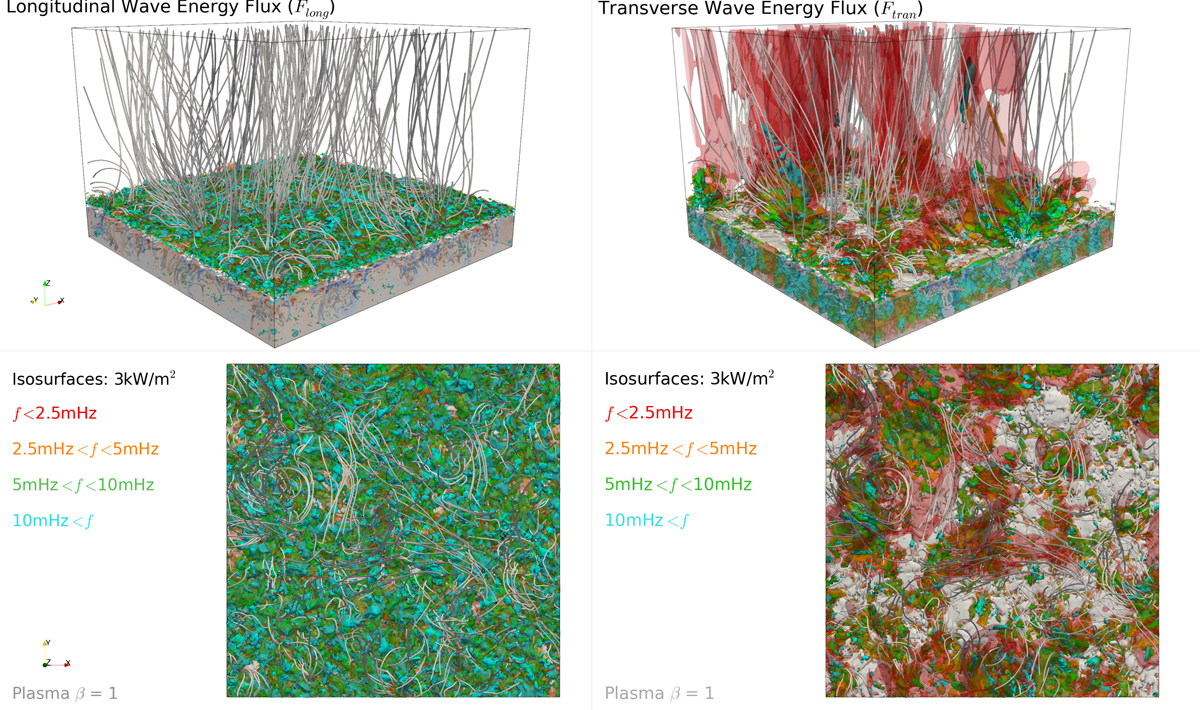
Fig. 17.
Download original image
3D visualisation of the Flong and Ftran wave-energy fluxes at t = 40 min. The magnetic field structure previously presented in Fig. 1, is now shown in grey. Semi-opaque isosurfaces highlight the wave-energy fluxes at 3 kWm−2 in each reconstructed frequency range; less than 2.5 mHz (red), between 2.5 mHz and 5 mHz (orange), between 5 mHz and 10 mHz (green), and greater than 10 mHz (cyan). The white opaque surface represents plasma β equal to one.
Current usage metrics show cumulative count of Article Views (full-text article views including HTML views, PDF and ePub downloads, according to the available data) and Abstracts Views on Vision4Press platform.
Data correspond to usage on the plateform after 2015. The current usage metrics is available 48-96 hours after online publication and is updated daily on week days.
Initial download of the metrics may take a while.