Fig. 13.
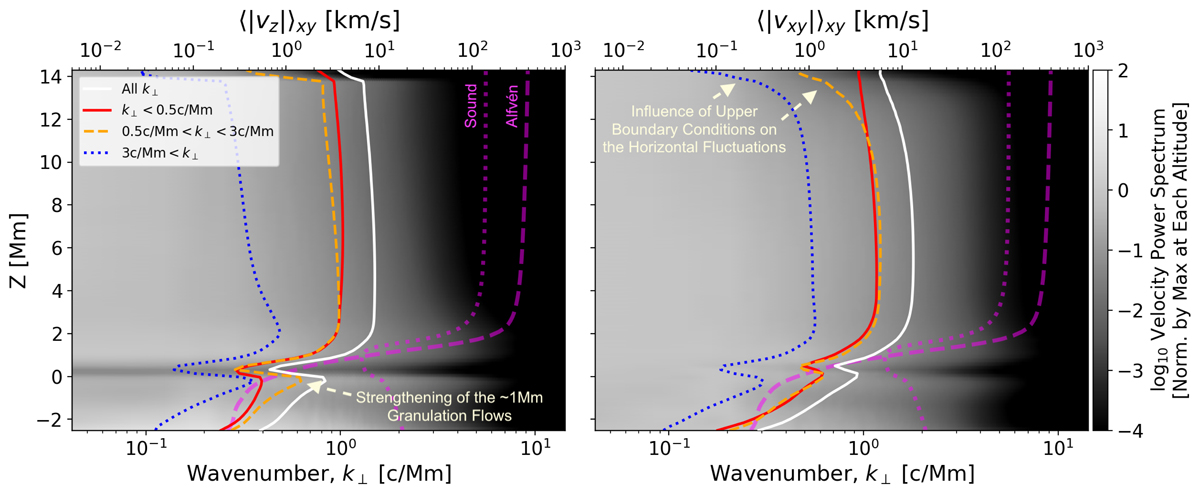
Download original image
Wavenumber power spectrum of the vertical (left) and horizontal (right) components of velocity, versus height (in both cases normalised by the maximum horizontal PS at each height). The PS of the vertical and horizontal flows become almost identical around Z = 1–1.5 Mm likely as a result of mode-conversion and/or magnetosonic shocks at the vA/cs = 1 surface, which allows for wave-energy to pass between longitudinal and transverse oscillations. The horizontally averaged velocity amplitude in overploted with a solid white line for each component. The amplitudes of the filtered velocity components from three wavenumber ranges, are similarly over-plotted with coloured lines. The time-averaged sound and Alfvén speeds versus height are also shown with magenta dotted and dashed lines, respectively.
Current usage metrics show cumulative count of Article Views (full-text article views including HTML views, PDF and ePub downloads, according to the available data) and Abstracts Views on Vision4Press platform.
Data correspond to usage on the plateform after 2015. The current usage metrics is available 48-96 hours after online publication and is updated daily on week days.
Initial download of the metrics may take a while.