Fig. 10.
Download original image
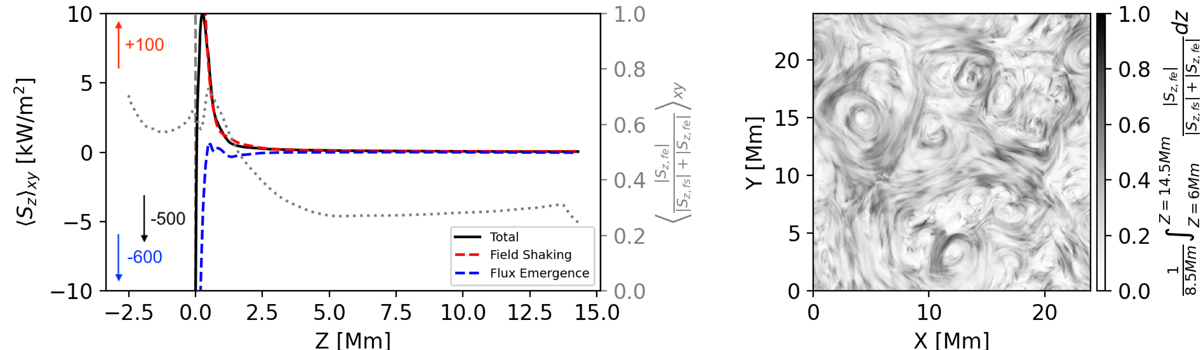
Comparison of the field shaking Sz, fs and flux emergence Sz, fe terms of the vertical Poynting flux in the simulation domain, at t = 40 min. Left: average total Poynting flux versus height in black, with the field shaking and flux emergence terms in red and blue respectively. Due to the range of scale, the y-axis is limited to a few kW/m2. The floating values indicate the approximate value of each term in the upper-convection zone. The average contribution of the flux emergence term to the vertical Poynting flux versus height is also shown. Right: this ratio is instead vertically averaged above 6 Mm (i.e. at the top of the simulation domain), again for t = 40 min. This highlights the network of magnetic swirls/funnels that exist throughout the domain.
Current usage metrics show cumulative count of Article Views (full-text article views including HTML views, PDF and ePub downloads, according to the available data) and Abstracts Views on Vision4Press platform.
Data correspond to usage on the plateform after 2015. The current usage metrics is available 48-96 hours after online publication and is updated daily on week days.
Initial download of the metrics may take a while.