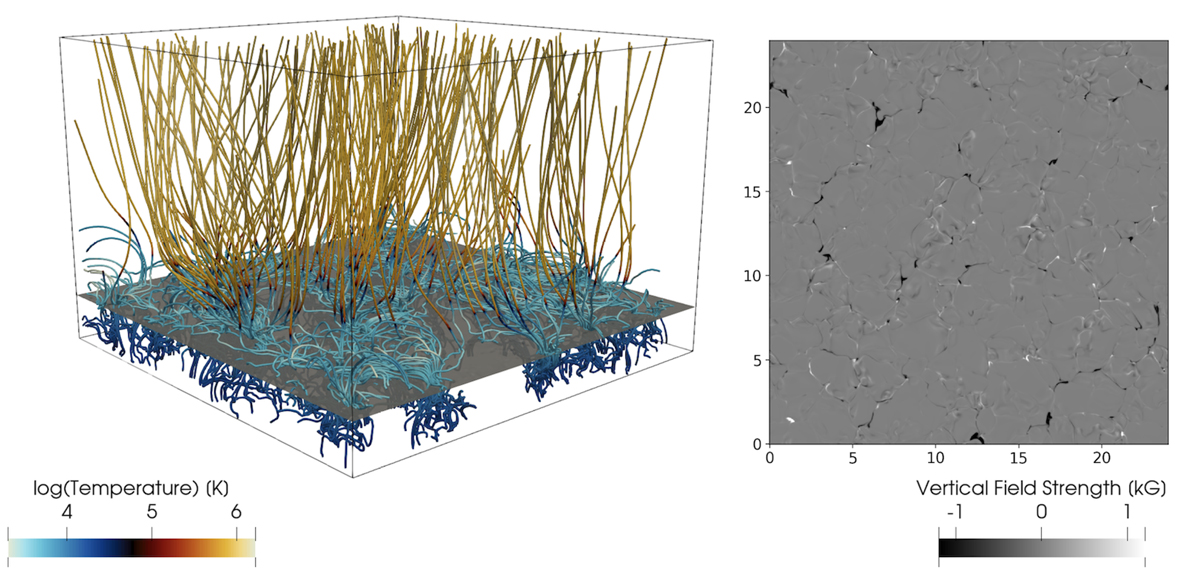
Fig. 1.
Download original image
3D visualisation of ch024031_by200bz005 at t = 40 min. The computational domain spans 24 Mm × 24 Mm × 17 Mm. Left: magnetic field lines are coloured by temperature from blue in the upper-convection zone (≈5800 K), to light blue in the temperature minimum region (≈3200 K), and finally yellow in the low corona (≈1 MK). Right: vertical magnetic field strength at the photosphere (Z = 0 Mm).
Current usage metrics show cumulative count of Article Views (full-text article views including HTML views, PDF and ePub downloads, according to the available data) and Abstracts Views on Vision4Press platform.
Data correspond to usage on the plateform after 2015. The current usage metrics is available 48-96 hours after online publication and is updated daily on week days.
Initial download of the metrics may take a while.