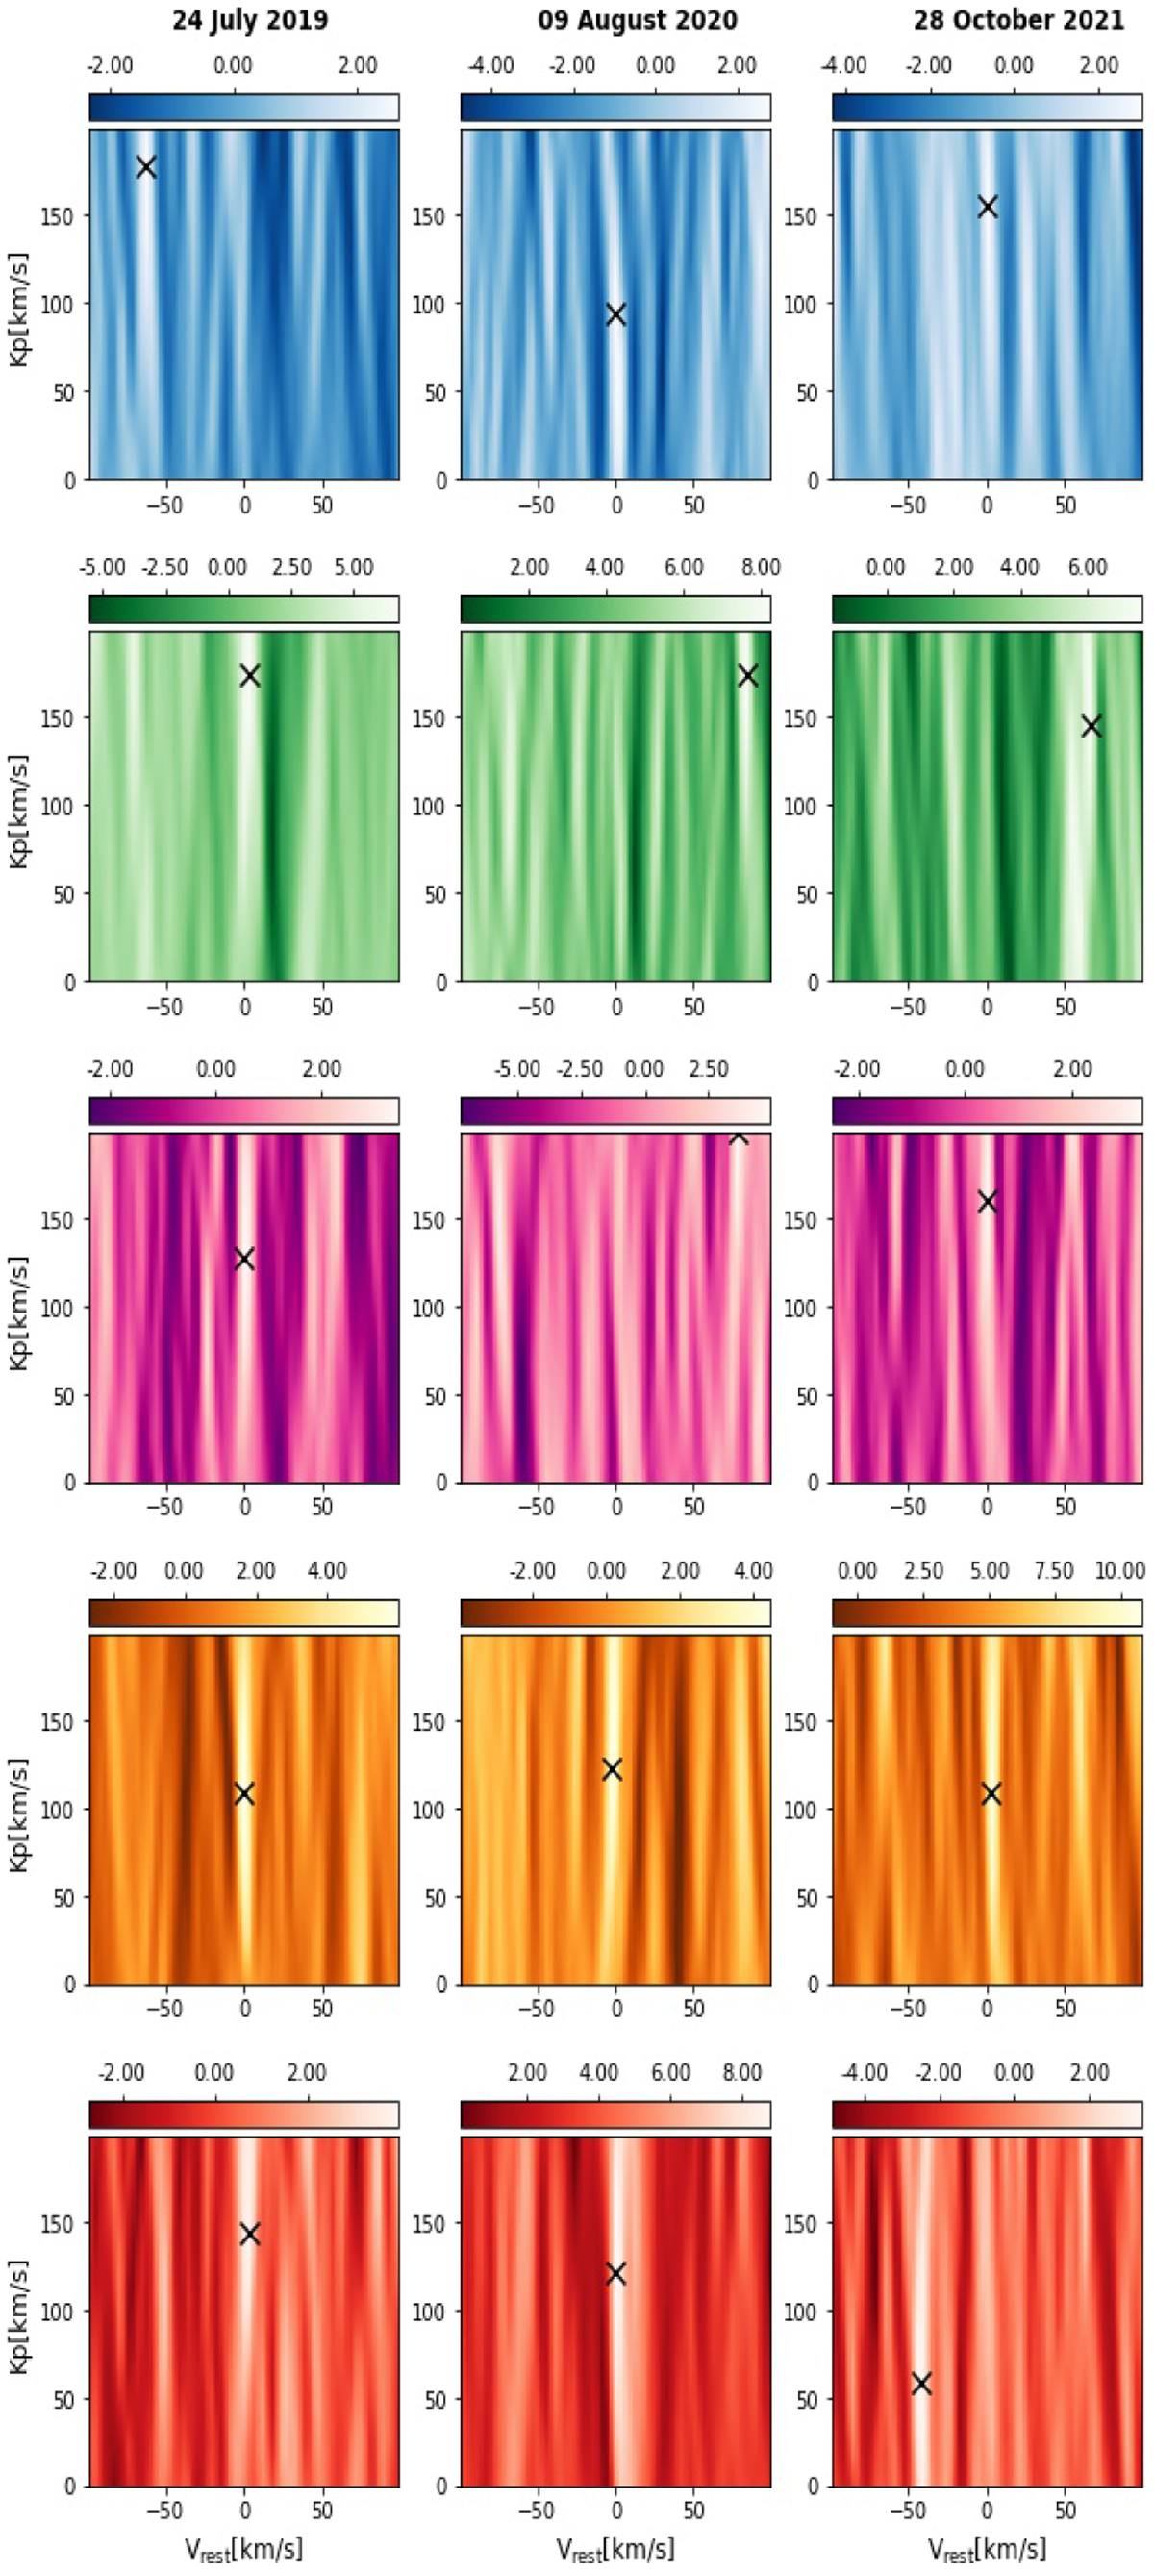
Fig. A.1
Download original image
S/N maps for the detected molecules for each night considered individually. The CC peaks are indicated by a black cross. As discussed in Giacobbe et al. (2021), species have weaker signatures and are not always detected in each individual transit. Nevertheless, they are firmly detected when more transits are co-added. These results show the advantage of our multi-night approach.
Current usage metrics show cumulative count of Article Views (full-text article views including HTML views, PDF and ePub downloads, according to the available data) and Abstracts Views on Vision4Press platform.
Data correspond to usage on the plateform after 2015. The current usage metrics is available 48-96 hours after online publication and is updated daily on week days.
Initial download of the metrics may take a while.