Fig. 4
Download original image
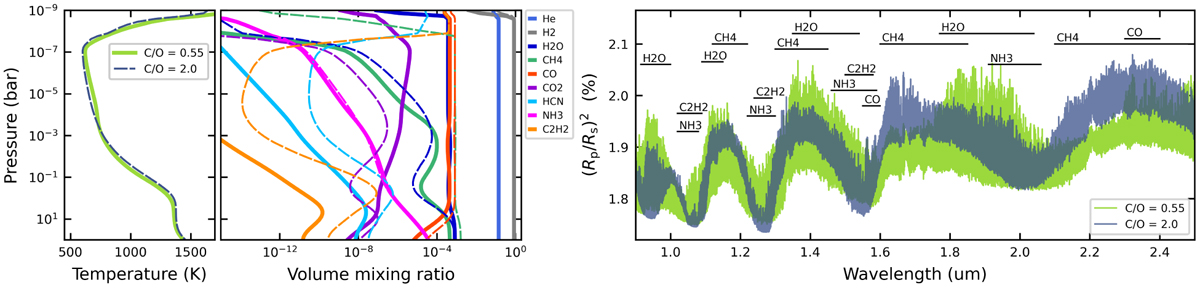
Sample atmospheric models for WASP-69b in radiative and thermochemical equilibrium. Left panel: equilibrium temperature profile for two models with solar elemental metallicity and a solar C/O ratio (solid green curve) or a super-solar ratio (dashed blue curve). Middle panel: equilibrium composition for the respective solar C/O model (solid curves) and super-solar C/O model (dashed curves), colour coded for each relevant species (see legend). Right panel: post-produced HR transmission spectra over the GIANO-B wavelength range, for the solar C/O model (green) and super-solar C/O model (blue). The horizontal black lines denote the wavelength ranges where each of the labelled species significantly impact the spectra.
Current usage metrics show cumulative count of Article Views (full-text article views including HTML views, PDF and ePub downloads, according to the available data) and Abstracts Views on Vision4Press platform.
Data correspond to usage on the plateform after 2015. The current usage metrics is available 48-96 hours after online publication and is updated daily on week days.
Initial download of the metrics may take a while.