Fig. 3
Download original image
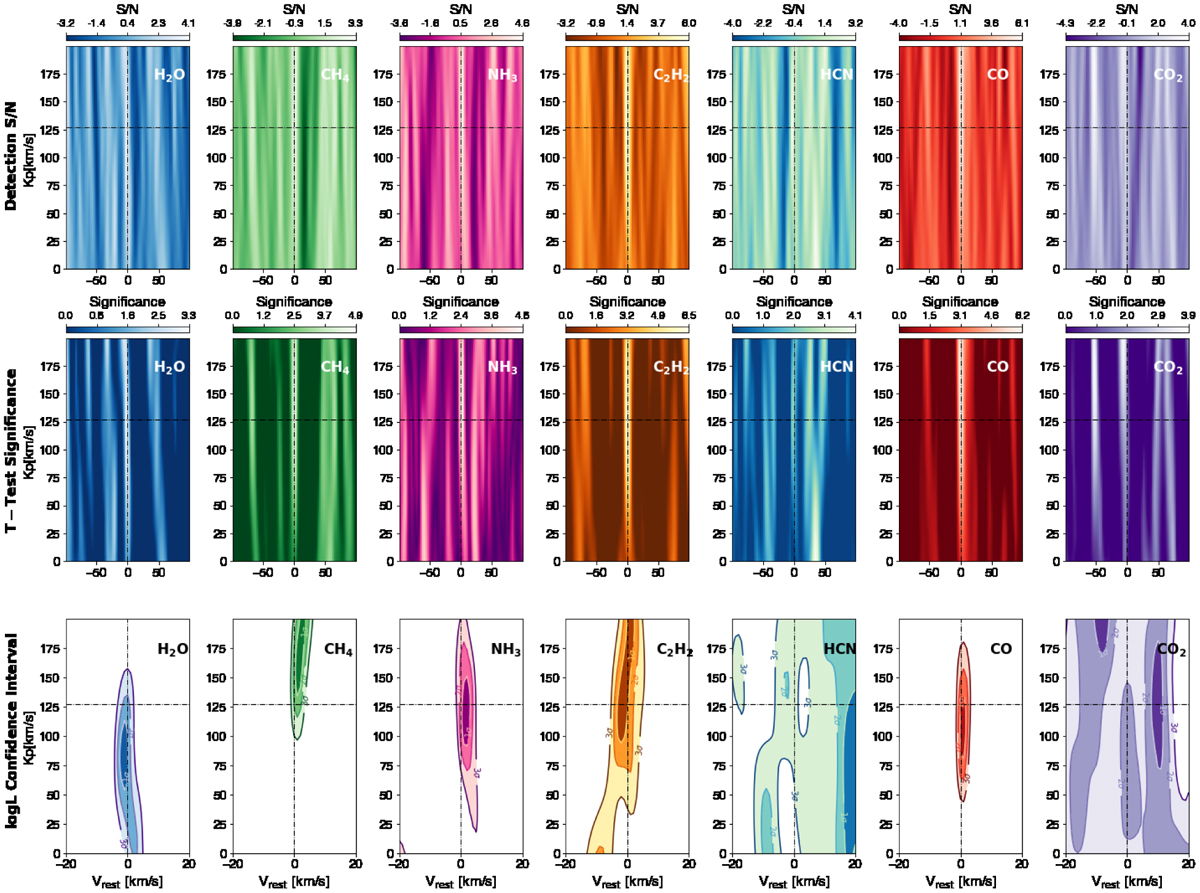
CC both in the S/N (top panel) and in the significance (middle panel) framework, and LH confidence intervals (bottom panel) maps for each investigated molecule as a function of the planet’s maximum RV (KP) and the planet’s rest-frame velocity (Vrest). The dotted lines denote the expected RV semi-amplitude of WASP-69b ![]() in the planet rest frame (Vrest = 0 km s−1). The detection significance increased when transits were co-added.
in the planet rest frame (Vrest = 0 km s−1). The detection significance increased when transits were co-added.
Current usage metrics show cumulative count of Article Views (full-text article views including HTML views, PDF and ePub downloads, according to the available data) and Abstracts Views on Vision4Press platform.
Data correspond to usage on the plateform after 2015. The current usage metrics is available 48-96 hours after online publication and is updated daily on week days.
Initial download of the metrics may take a while.