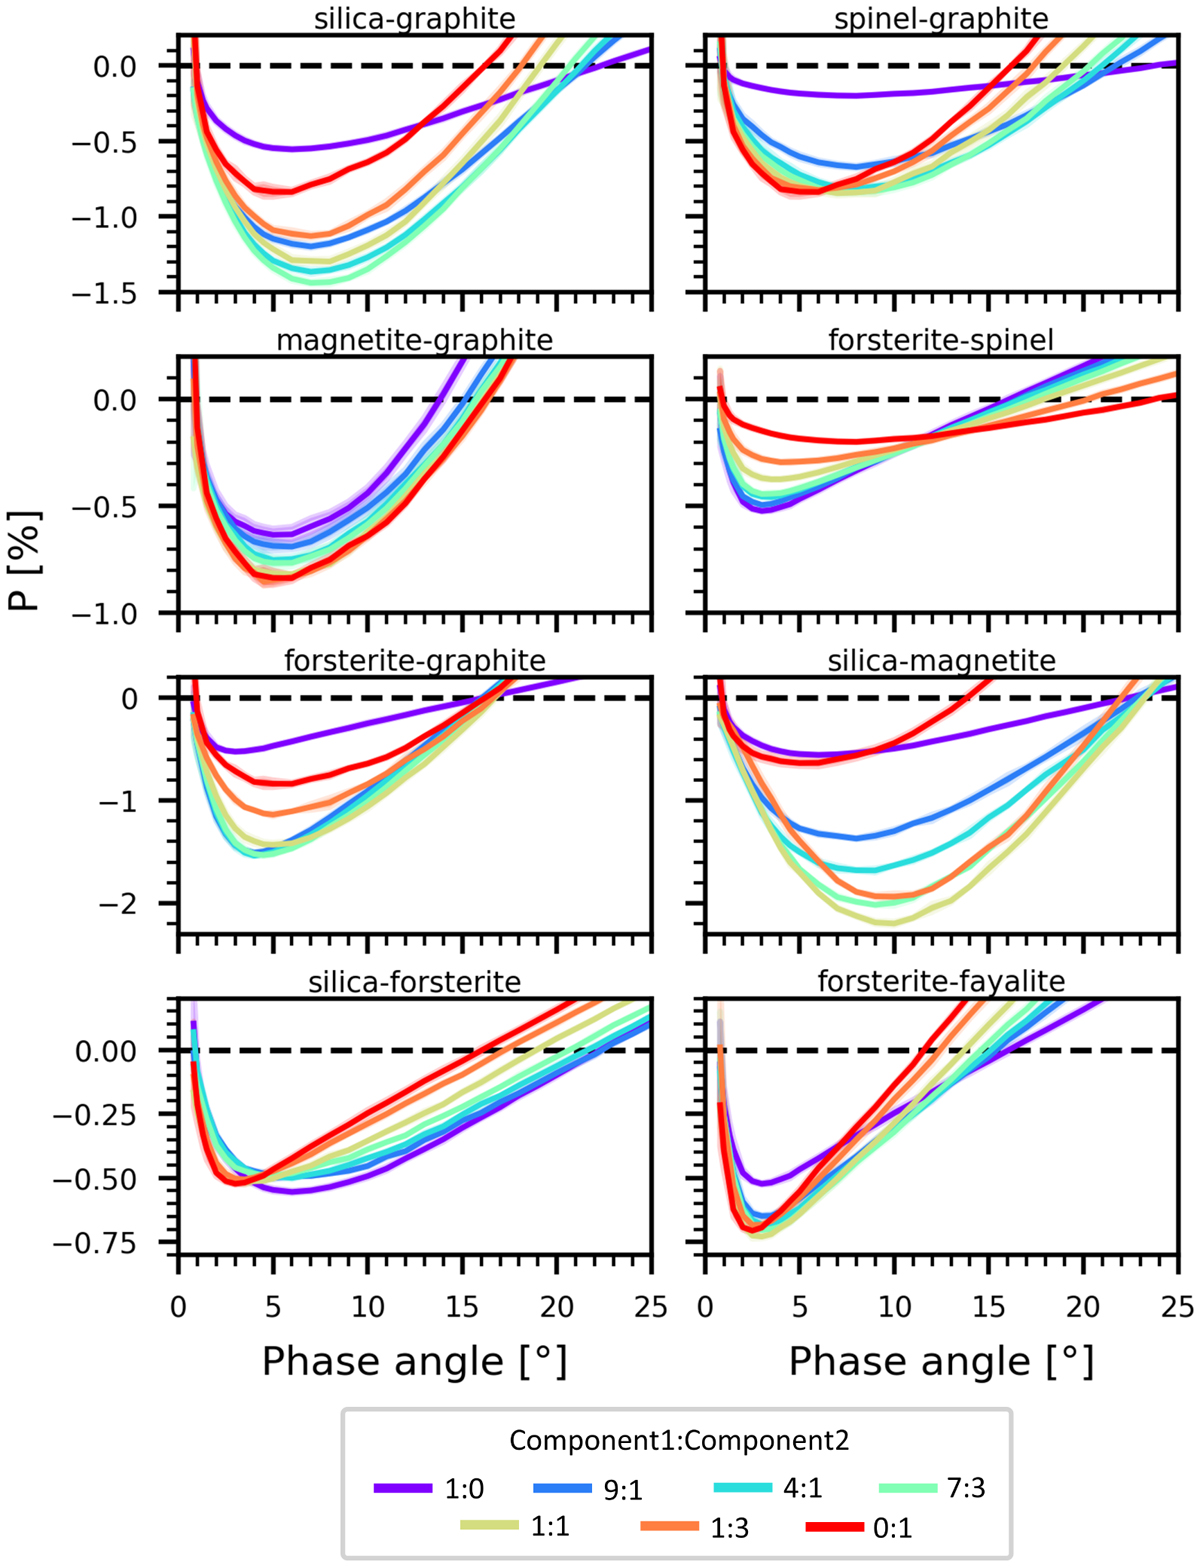
Fig. 4
Download original image
Polarization phase curves of binary mixtures. The two mineral components are mixed with mass ratios shown in different colors. The endmembers of the mixture are plotted in purple and red. The mass ratios of the two components mixed together (1:0, 9:1, 4:1, 7:3, 1:1, 1:3, and 0:1) are equivalent to 100–0%, 90–10%, 80–20%, 70–30%, 50–50%, 25–75%, and 0–100% of the total mass being first and second endmember. The shaded areas around the curves denote the standard deviation, which in this figure is often smaller than the line width.
Current usage metrics show cumulative count of Article Views (full-text article views including HTML views, PDF and ePub downloads, according to the available data) and Abstracts Views on Vision4Press platform.
Data correspond to usage on the plateform after 2015. The current usage metrics is available 48-96 hours after online publication and is updated daily on week days.
Initial download of the metrics may take a while.