Open Access
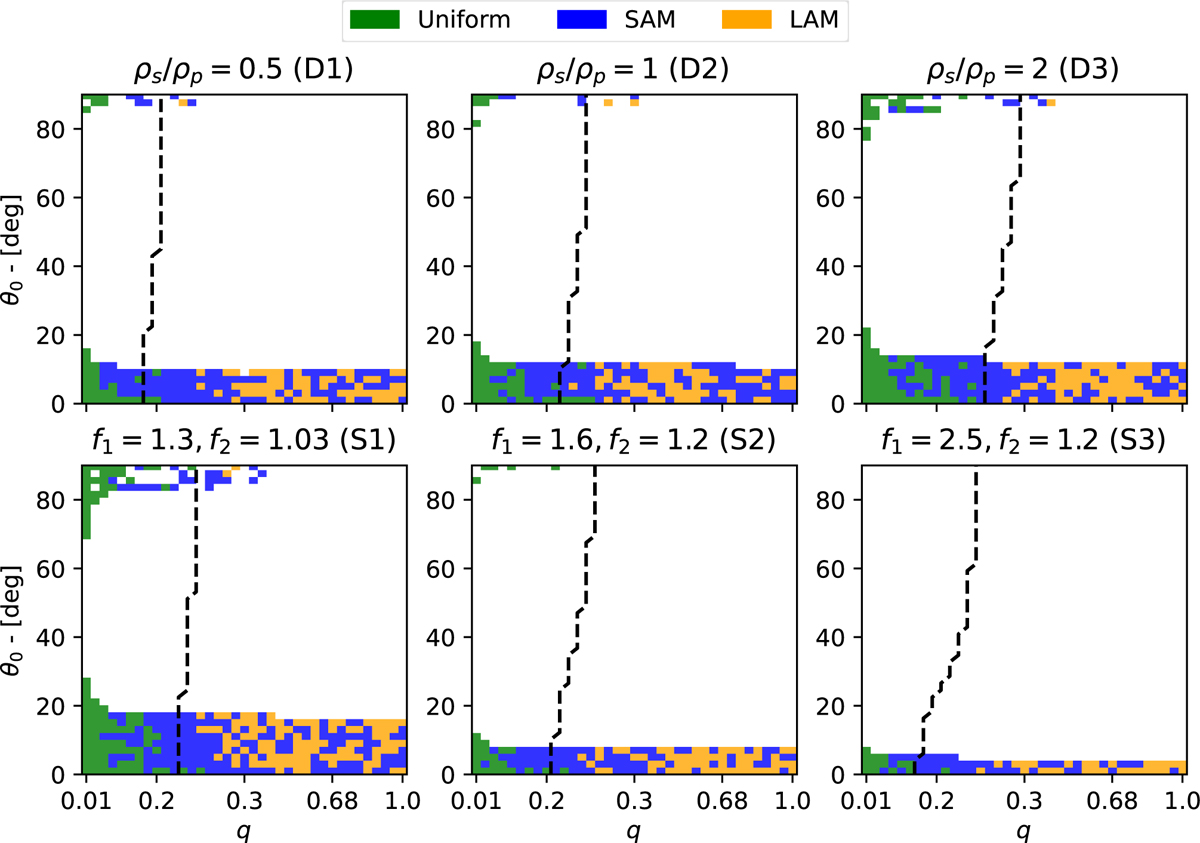
Fig. 9
Download original image
Distribution of the rotation state of the primary, at the end of the simulation, as functions of q and θ0. The white regions correspond to simulations that result in collisions. The dashed lines indicate the value of q where the total energy is zero.
Current usage metrics show cumulative count of Article Views (full-text article views including HTML views, PDF and ePub downloads, according to the available data) and Abstracts Views on Vision4Press platform.
Data correspond to usage on the plateform after 2015. The current usage metrics is available 48-96 hours after online publication and is updated daily on week days.
Initial download of the metrics may take a while.