Fig. 8
Download original image
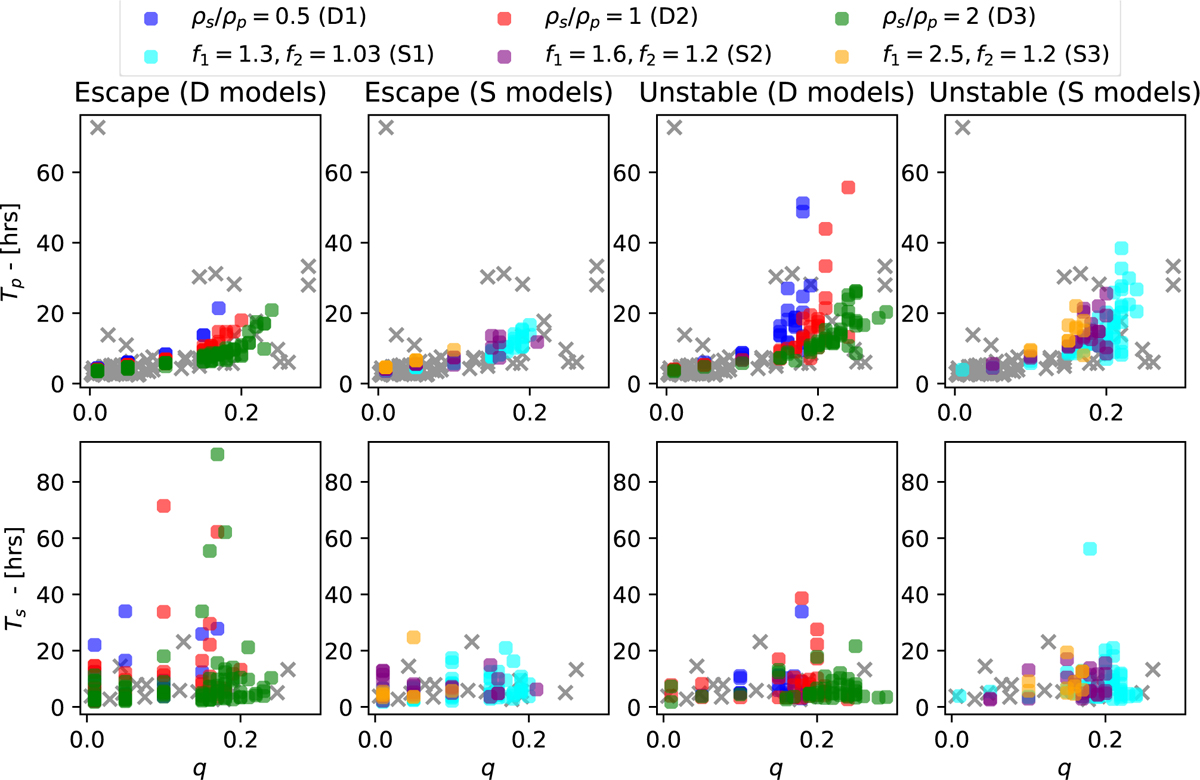
Distribution of rotation periods, as functions of mass ratio, for non-collision systems with positive total energy. The top and bottom rows correspond to the rotation period of the primary and secondary, at t = 200 days, respectively. The first and second columns show the escape cases, while the third and fourth columns show the unstable cases. The D and S models correspond to models D1–D3 and S1–S3, respectively. The gray crosses are data from Pravec et al. (2019), and only asteroid pairs with q < 0.3 are included in the figure.
Current usage metrics show cumulative count of Article Views (full-text article views including HTML views, PDF and ePub downloads, according to the available data) and Abstracts Views on Vision4Press platform.
Data correspond to usage on the plateform after 2015. The current usage metrics is available 48-96 hours after online publication and is updated daily on week days.
Initial download of the metrics may take a while.