Open Access
Fig. 7
Download original image
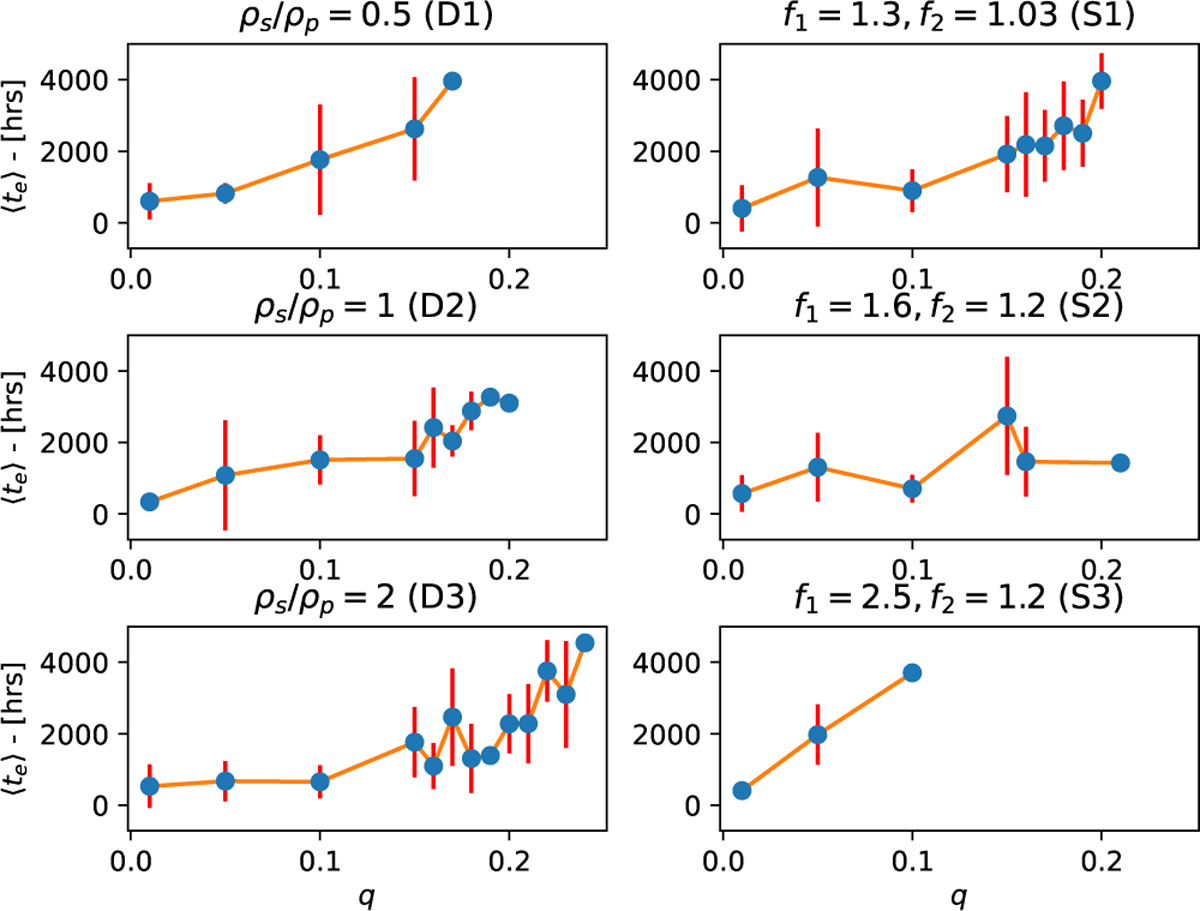
Escape times, averaged over the 45 initial values of θ0, as functions of the mass ratio. The left columns show the varied density models, while the right columns show the varied shape models. The error bars show the standard deviation of the escape times at the given mass ratio.
Current usage metrics show cumulative count of Article Views (full-text article views including HTML views, PDF and ePub downloads, according to the available data) and Abstracts Views on Vision4Press platform.
Data correspond to usage on the plateform after 2015. The current usage metrics is available 48-96 hours after online publication and is updated daily on week days.
Initial download of the metrics may take a while.