Fig. 6
Download original image
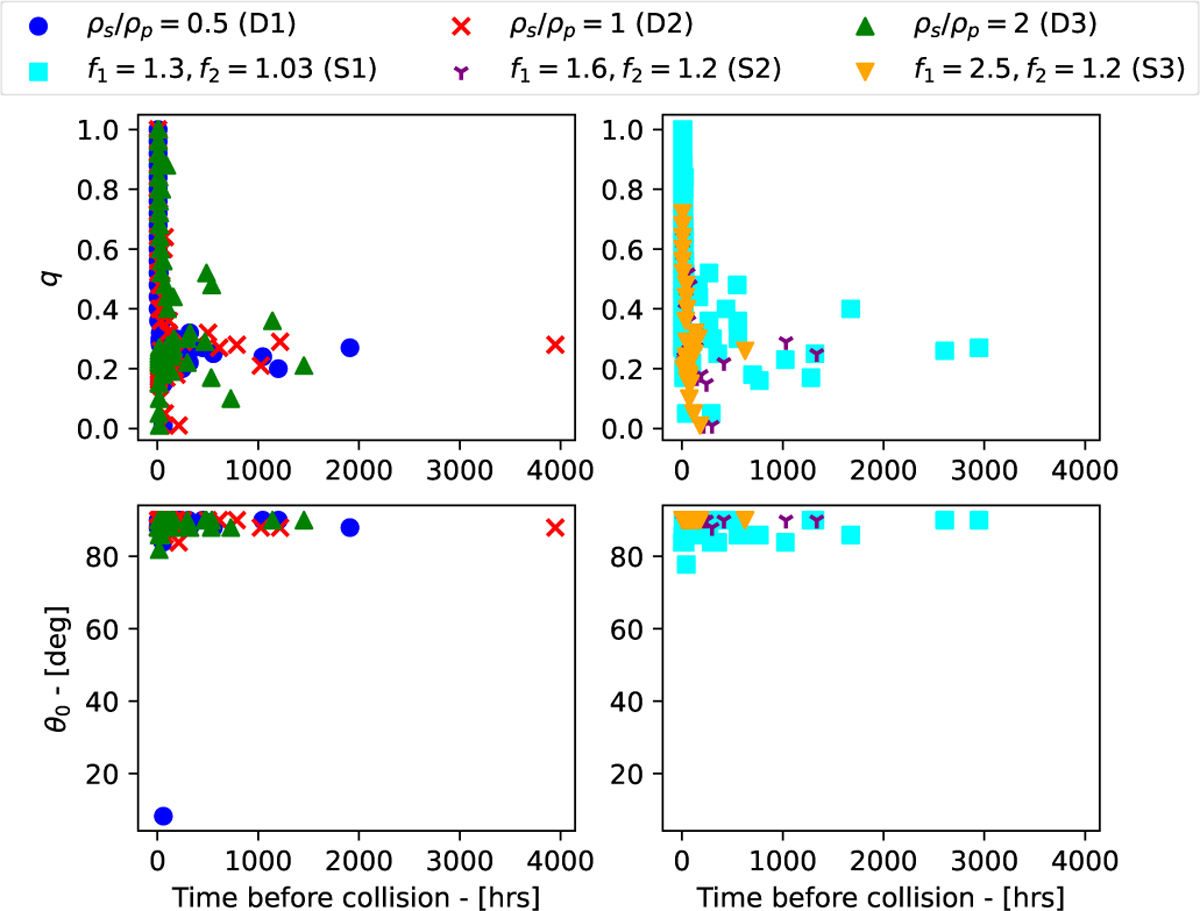
Distribution of mass ratio (top) and initial tilt angle (bottom) as functions of time before collision. The left and right panels show the models with varied density and varied shape, respectively. Collisions that occur before 5 h have elapsed are excluded from this plot. For the remaining simulations shown in the figure, the average time it takes to collide is 143 h, 166 h, and 133 h for models D1, D2, and D3, respectively, while the average is 171 h, 193 h and 79 h for models S1, S2, and S3 models, respectively.
Current usage metrics show cumulative count of Article Views (full-text article views including HTML views, PDF and ePub downloads, according to the available data) and Abstracts Views on Vision4Press platform.
Data correspond to usage on the plateform after 2015. The current usage metrics is available 48-96 hours after online publication and is updated daily on week days.
Initial download of the metrics may take a while.