Fig. 8
Download original image
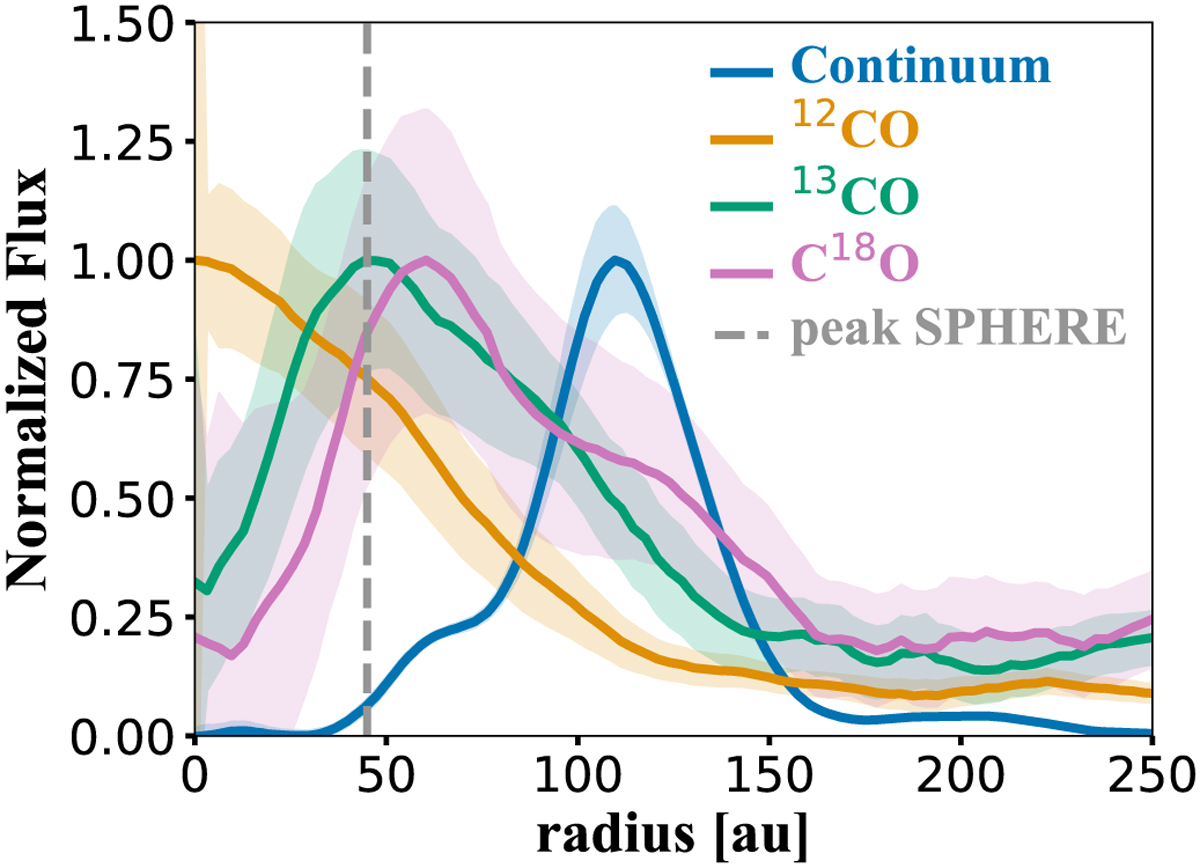
Azimuthally averaged radial intensity profiles of the deprojected images of the continuum, and moment 0 maps of the 12CO, 13CO, and C18O of LkHα 330 from ALMA Band-6 observations. Each profile is normalized to the peak. The shaded area is the standard deviation of each elliptical bin divided by the square root of the number of beams spanning the full azimuthal angle at each radial bin.
Current usage metrics show cumulative count of Article Views (full-text article views including HTML views, PDF and ePub downloads, according to the available data) and Abstracts Views on Vision4Press platform.
Data correspond to usage on the plateform after 2015. The current usage metrics is available 48-96 hours after online publication and is updated daily on week days.
Initial download of the metrics may take a while.