Fig. 4
Download original image
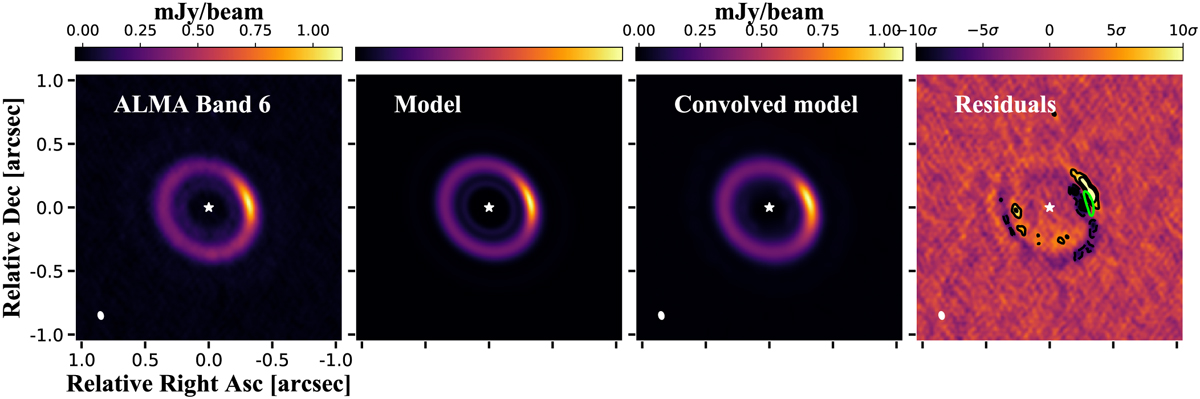
Observations versus model images from our best fit with galario (before and after convolution) and the residuals. The contours of the residual map are [−10σ, −5σ, 5σ, 10σ], where negative values are dashed contours and positive values solid contours. The green contour in the residual map shows the area that encloses 80% of the peak of the emission from the observations as a reference.
Current usage metrics show cumulative count of Article Views (full-text article views including HTML views, PDF and ePub downloads, according to the available data) and Abstracts Views on Vision4Press platform.
Data correspond to usage on the plateform after 2015. The current usage metrics is available 48-96 hours after online publication and is updated daily on week days.
Initial download of the metrics may take a while.