Fig. 3
Download original image
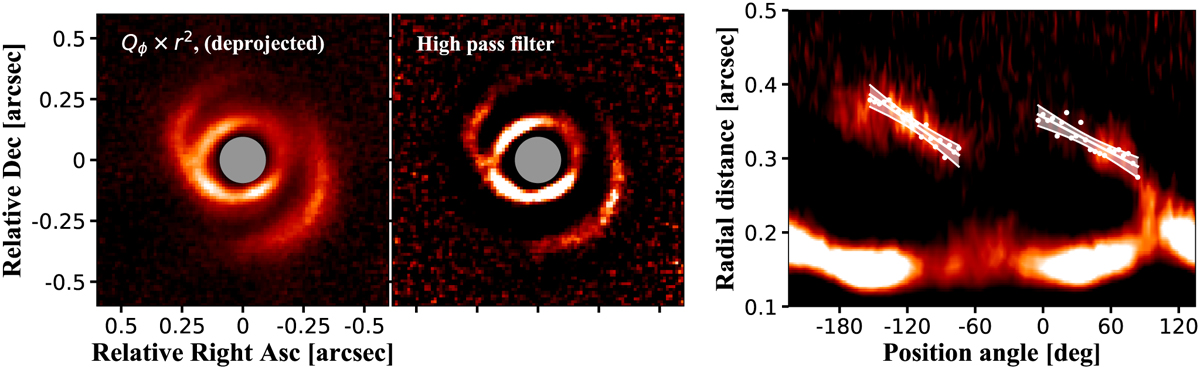
SPHERE observations of LkHα 330. Left panel: Q∅ of the H-band observations after multiplying by r2 and deprojection. Center panel: high pass filtered image. Right panel: polar mapping from 0.1″ to 0.5″ of the sharper image in the center panel. The white lines show the spiral fit described in the text, and the shaded areas show the 3 σ uncertainty of the fit. In this case, the axis of the position angle is shifted in comparison with Fig. 2 for a better visualization of the fit.
Current usage metrics show cumulative count of Article Views (full-text article views including HTML views, PDF and ePub downloads, according to the available data) and Abstracts Views on Vision4Press platform.
Data correspond to usage on the plateform after 2015. The current usage metrics is available 48-96 hours after online publication and is updated daily on week days.
Initial download of the metrics may take a while.