Fig. 10
Download original image
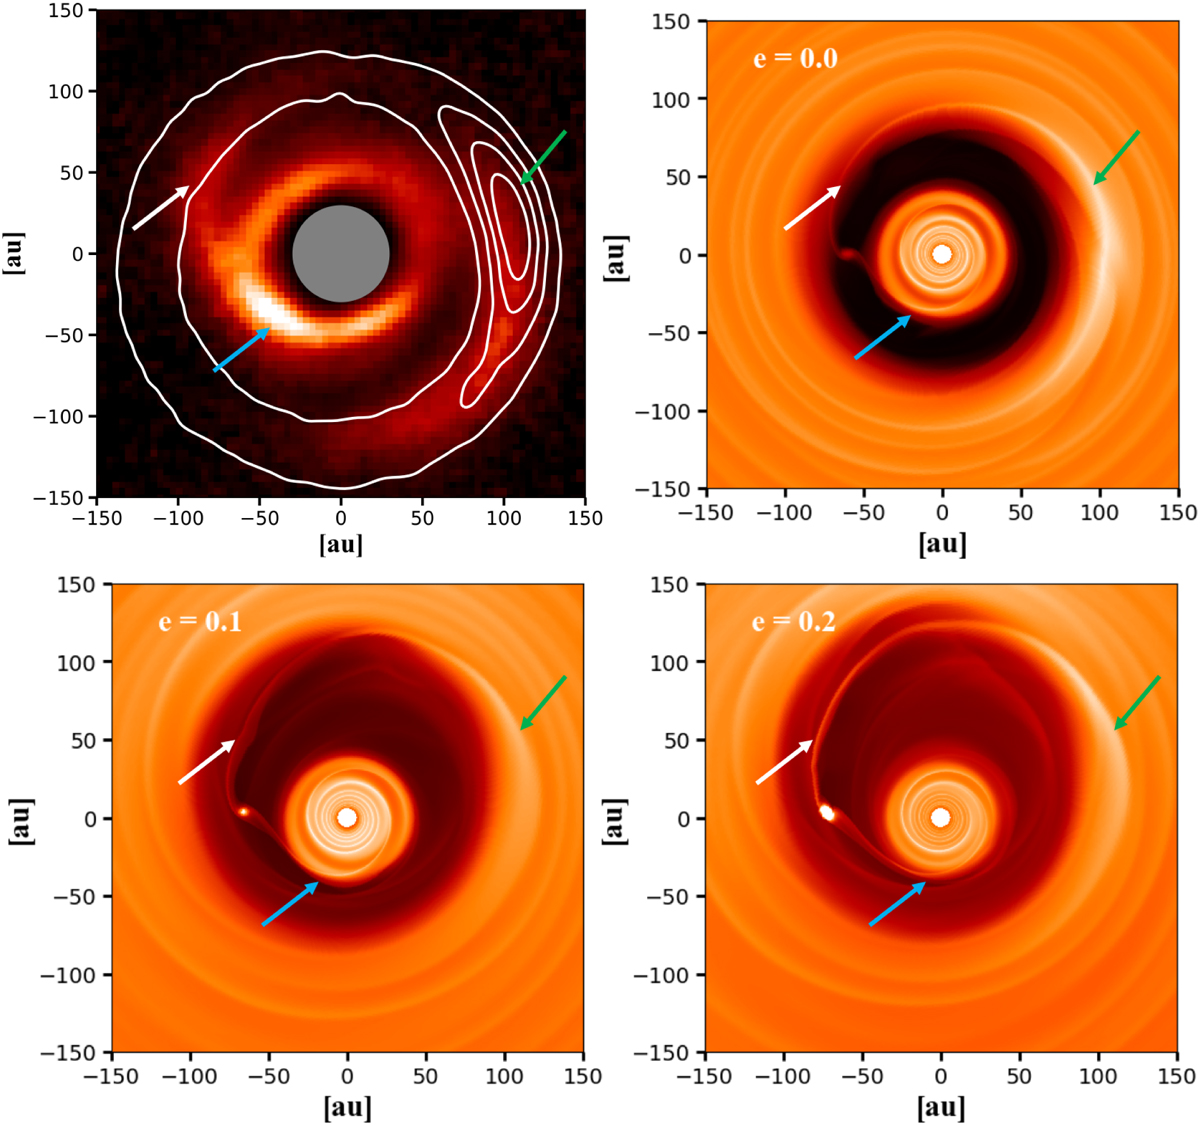
Comparison of models and observations. Upper left panel: overlap of ALMA and SPHERE observations, both images are deprojected, and a distance of 318 pc is used to change the units to au. The colors are SPHERE data of LkHα 330 in the H-band (Q∅ × r2) in linear scale, and the contours are ALMA data of LkHα 330 in Band 6 (1.3mm) every 20%, 40%, 60%, and 80% of the peak of the emission. Other panels: zoomed-in view of the dust density distribution of 1 µm-sized dust particles from the hydrodynamical simulations shown in Fig. 9 for the three values of the eccentricity. The same coronograph as the SPHERE observations covers the inner disk. The arrows aim to qualitatively compare the observed structures (especially from SPHERE) with the models.
Current usage metrics show cumulative count of Article Views (full-text article views including HTML views, PDF and ePub downloads, according to the available data) and Abstracts Views on Vision4Press platform.
Data correspond to usage on the plateform after 2015. The current usage metrics is available 48-96 hours after online publication and is updated daily on week days.
Initial download of the metrics may take a while.